• Visão global
  • Comentários (1)
  • Discussão (6)
  • O que há de novo

TTF Candles AM

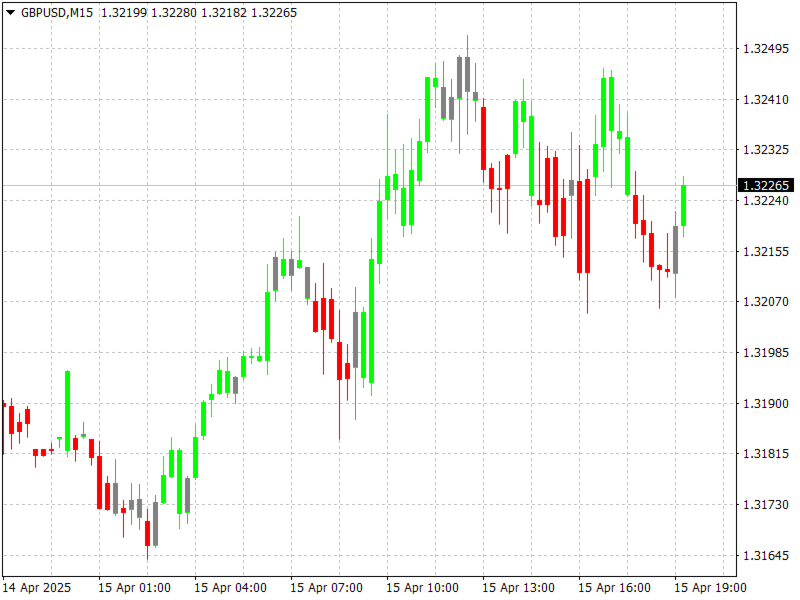
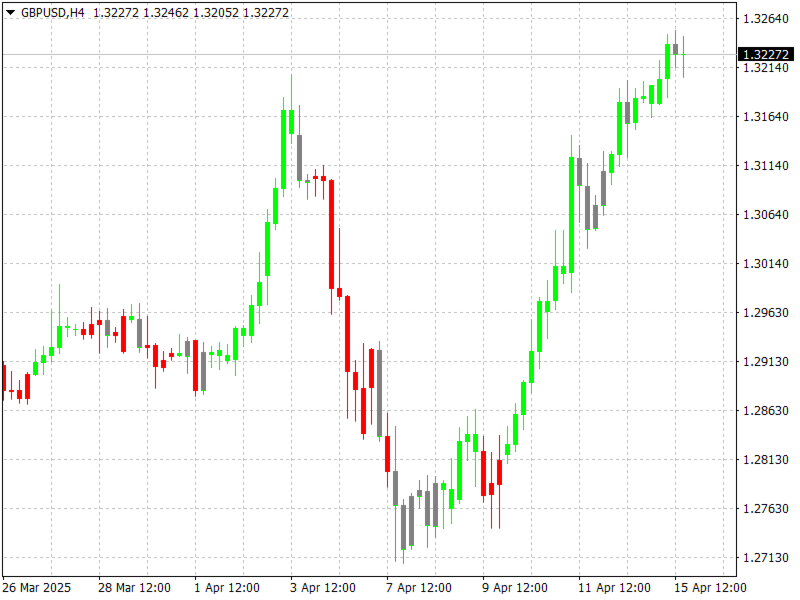
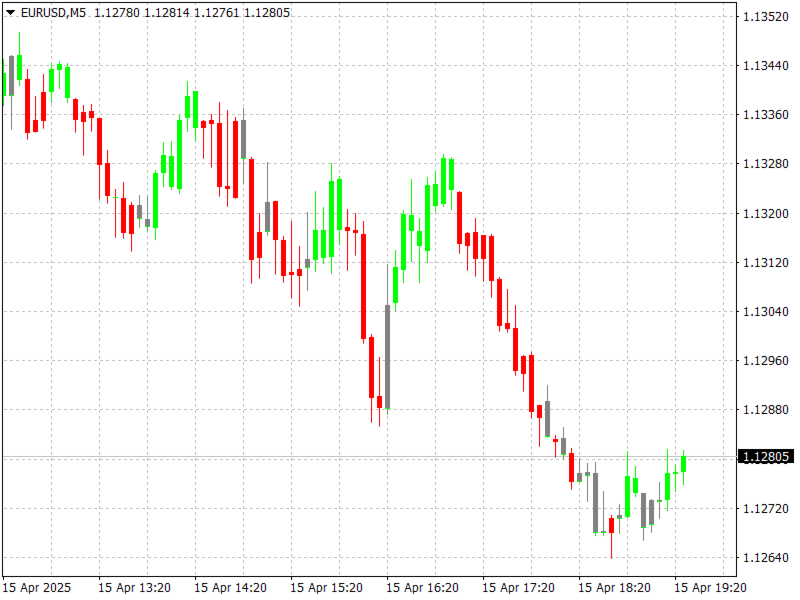
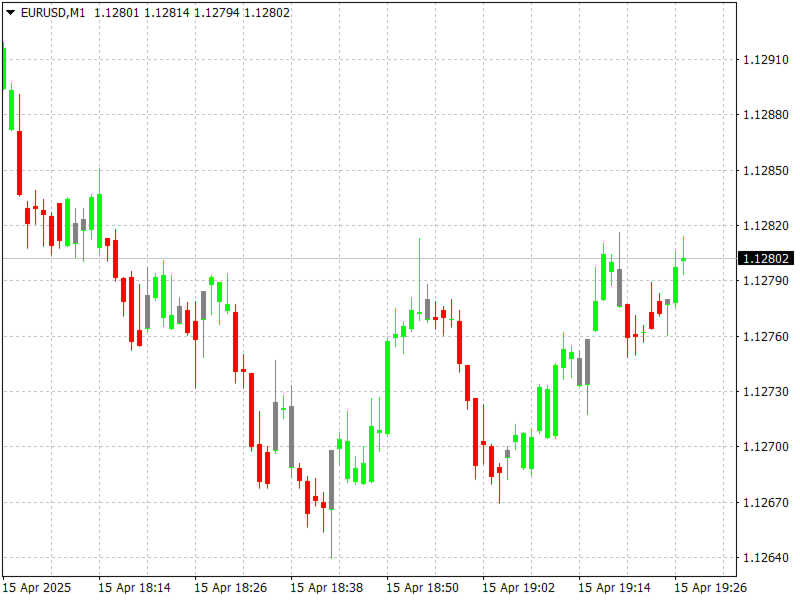
The presented indicator is an original development based on the TTF (Trend Trigger Factors) indicator.

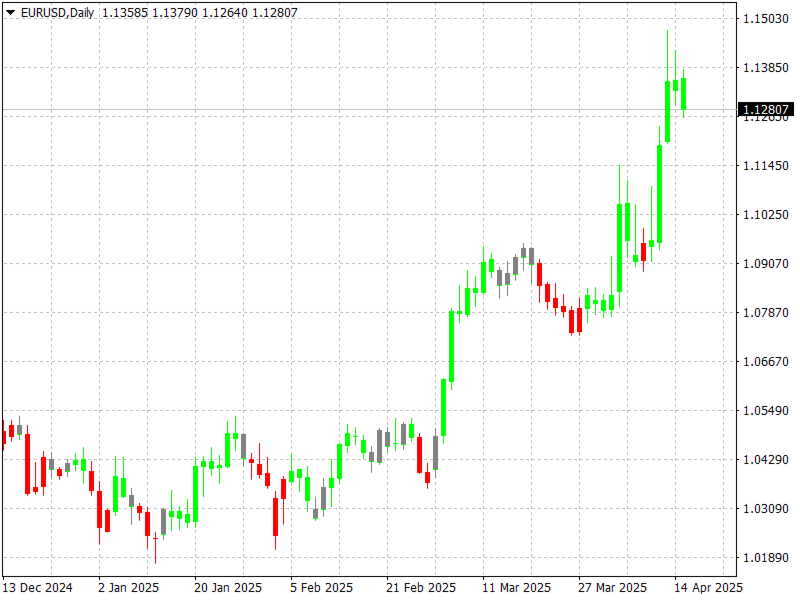
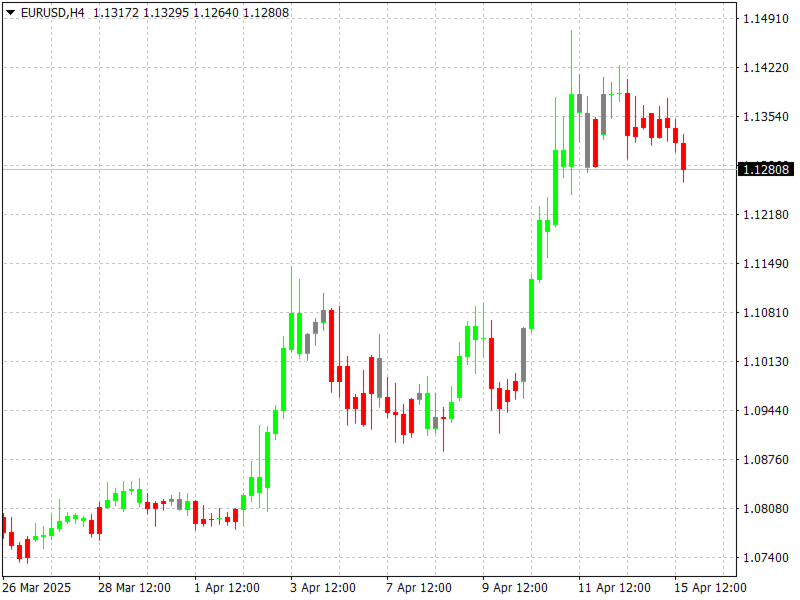
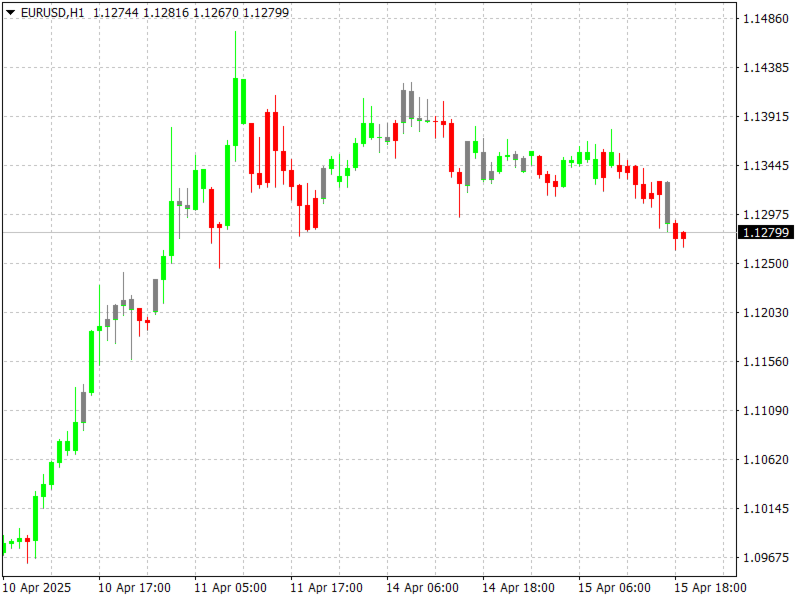
The indicator colors the price chart candles according to the TTF indicator data and its smoothed value (Signal line).

The indicator does not repaint.

The following thesis is used:

  • The intersection of the TTF oscillator with the zero value is a buy/sell signal.
  • The intersection of the TTF oscillator with its smoothed value is a signal of a change in trend.

Thus:

  • If the TTF indicator is greater than zero and greater than its smoothed value, the candle is colored in the colors of the uptrend.
  • If the TTF indicator is less than zero and less than its smoothed value, the candle is colored in the colors of the downtrend.
  • Otherwise, the price chart candle is colored in the colors of the sideways trend.

Use rules:

  • The first candle colored in the colors of the uptrend is a signal to buy and set stop orders for open sell positions.
  • The first candle painted in the colors of the downtrend is a signal to sell and set stop orders for open buy positions.
  • The first candle painted in the colors of the sideways trend is a signal to set stop orders for all types of open positions.
  • The signal is confirmed when the price crosses the maximum/minimum of the bar on which the signal was given.

Configurable indicator parameters:

  • Indicator_Period - period for calculating the TTF indicator;
  • Shift_Signal_Line - shift of the signal line relative to the TTF indicator;
  • Method_Signal_Line - method of smoothing the signal line;
  • Period_Signal_Line - period of smoothing the signal line.

    Attention:

    It should be taken into account that any market is constantly changing and there is no guarantee that methods that were effective in the past will be effective in the future.

    To minimize potential losses, you should regularly optimize the product parameters, study the results of its work and withdraw part of the profit received.

    It is recommended that before using the product on a real account, you test its work on a demo account on the same market and with the same broker where you plan to trade.

    With respect and best wishes,

    Andriy Matviyevs'kyy


    P.S.

    If you liked this product, I would be grateful for a fair assessment - positive user reviews motivate the author, and reasonable criticism allows us to make products better.

    I suggest visiting my page where you will find many unique author's works that are the result of many years of studying exchange trading and FOREX trading.


    Produtos recomendados
    Custom Pattern Detector Indicator This indicator lets you define your own custom pattern instead of the typical candlestick patterns. Everybody already knows about common candlestick patterns like the Doji pattern. This indicator is different though. The pattern you will define is a custom pattern based on CANDLE FORMATIONS . Once the indicator knows the pattern you want it to look for, then it will go through history on the chart and find matching patterns, make them visible to you, and calcula
    FREE
    Mr Beast Sniper
    Luis Mariano Vazquez Marcos
    Asesor Experto "Sniper FX": Precisión Milimétrica para Tus Operaciones El asesor experto "Sniper FX" redefine la precisión en el trading automatizado al ofrecer un enfoque estratégico centrado en pocas, pero extraordinariamente precisas, entradas en el mercado. Inspirado por la agudeza de un francotirador, este asesor experto utiliza algoritmos avanzados para identificar oportunidades óptimas de compra y venta, maximizando el potencial de beneficios mientras minimiza la exposición al mercado.
    FREE
    Heiken Ashi Smoothed Indicator MT4 Introduction The  Heiken Ashi Smoothed Indicator  accurately identifies trends and reduces price noise. This indicator for the MetaTrader 4 platform is an updated and improved version of the standard  Heiken Ashi  candles. This indicator is formed as a moving average (composed of Heiken Ashi candles) around the price, and the position of the price relative to the moving average determines whether the trend is  upward (Uptrend)  or  downward (Downtrend) . «Indi
    FREE
    O Captador de Tendências: A Estratégia do Captador de Tendências com Indicador de Alerta é uma ferramenta versátil de análise técnica que auxilia os traders na identificação de tendências de mercado e potenciais pontos de entrada e saída. Apresenta uma Estratégia dinâmica do Captador de Tendências, adaptando-se às condições do mercado para uma representação visual clara da direção da tendência. Os traders podem personalizar os parâmetros de acordo com suas preferências e tolerância ao risco. O
    FREE
    Evergreen Tokyo
    Yutaka Takahashi
    EVERGREEN - EA de escalpelamento breakout totalmente automatizado com durabilidade de 20 anos. INTRODUÇÃO - Personalizável e será atualizado gradualmente, outras moedas disponíveis! Ambiente de validação altamente preciso com TDS (Tick Data Suite) O EVERGREEN é desenvolvido e verificado usando dados precisos de ticks que reproduzem fielmente o ambiente real. A lógica é concebida com ênfase no desempenho do mundo real, sem recorrer a composições não naturais ou à otimização excessiva. “Seguro
    FREE
    The Level Moving Averages Message indicator ( see the description and video ) does not draw the Moving Average line in the chart window but marks the Moving Average level on all time frames in accordance with the specified parameters. The level move frequency corresponds to the TimeFrame parameter value specified. The advantage of this indicator lies in the fact that it offers the possibility of monitoring the interaction between the price and the MA of a higher time frame on a lower one (e.g.,
    Price Ladder
    Kourosh Hossein Davallou
    This indicator is based on the Channel . Input Parameters channel_One - show trend line One on or off. timeFrame_One  - time Frame of channel One . ColorChannel_One  - color of  trend line One. channel_Two - show trend line Two on or off. timeFrame_Two  - time Frame of channel Two . ColorChannel_Two  - color of  trend line Two. channel_Three - show trend line Three on or off. timeFrame_Three  - time Frame of channel Three . ColorChannel_Three  - color of  trend line three. channel_Four - show tr
    FREE
    PointsVsBars
    Stanislav Korotky
    This indicator provides a statistical analysis of price changes (in points) versus time delta (in bars). It calculates a matrix of full statistics about price changes during different time periods, and displays either distribution of returns in points for requested bar delta, or distribution of time deltas in bars for requested return. Please, note, that the indicator values are always a number of times corresponding price change vs bar delta occurred in history. Parameters: HistoryDepth - numbe
    FREE
    MACD in MA
    Nikolaos Pantzos
    iMACD in iMA is indicator to change color in iMA if iMACD is upper of zero (up trend) or lower of zero (down trend). It is a useful tool to track when the upside and the downside iMACD on iMA. You can to get source code from here . Parameters MA_Periods — Period for iMA. MA_Method — Method for iMA. MACD_FastEMA — Fast EMA for MACD. MACD_SlowEMA — Slow EMA for MACD. MACD_SignalSMA — SMA signal for MACD. MACD_ApliedPrice — Price used for MACD. BarsCount — How many bars will show the line. Revers
    FREE
    The indicator detects and displays М. Gartley's Butterfly pattern. The pattern is plotted by the extreme values of the ZigZag indicator (included in the resources, no need to install). After detecting the pattern, the indicator notifies of that by the pop-up window, a mobile notification and an email. The pattern and wave parameters are displayed on the screenshots. The default parameters are used for demonstration purposes only in order to increase the amount of detected patterns. Parameters z
    Free automatic Fibonacci is an indicator that automatically plots a Fibonacci retracement based on the number of bars you select on the BarsToScan setting in the indicator. The Fibonacci is automatically updated in real time as new highest and lowest values appears amongst the selected bars. You can select which level values to be displayed in the indicator settings. You can also select the color of the levels thus enabling the trader to be able to attach the indicator several times with differe
    FREE
    I make this indicator to help you for setting effective stoploss and getting more signals from following trends. This indicator helps to tell the trends and sideway, when 2 lines stand above of blue cloud, it means uptrend. When 2 lines stand above red cloud, it means down trend, the other else, it means sideway market. For taking order, you have to wait the arrows. You also need to see the cloud position, if the cloud's res, you have to wait the yellow arrow for selling order. If the cloud's bl
    FREE
    Description:  For a comprehensive understanding of our indicators, we invite you to explore the entire Q&A section within this MQL5 blog post   here . The "High Spread Alert" Indicator is a valuable tool for traders, providing real-time information about spread fluctuations in the forex market. As a technical analysis tool, it helps traders make informed decisions by alerting them to periods of high spread, which can impact trading conditions and execution. Key Features: Spread Monitoring: The i
    FREE
    TwoMA Crosses
    Nedyalka Zhelyazkova
    TwoMA Crosses indicator displays arrows based on whether the short term moving average crosses above or below the long term moving average. A moving average doesn't predict price direction. Instead, it defines the current direction. Despite this, investors use moving averages to filter out the noise. Traders and investors tend to use the EMA indicator, especially in a highly volatile market because it’s more sensitive to price changes than the SMA. Download for FREE  TwoMA Crosses  EA from the
    FREE
    SimSim Histogram open up or down O indicador calcula e resume os dados de 25 indicadores padrão. Quais indicadores padrão usar, o profissional determina por si mesmo. Como resultado do cálculo, obtemos o nível atual do sinal e colorimos o histograma por cor: compra, venda ou valor neutro. O indicador implementa um sistema de teste que pode ser testado baixando a versão demo. Um indicador pode ser um bom complemento para sua estratégia de negociação. PRIMEIRA AVALIAÇÃO DO TESTE - ENTÃO ALUGUEL
    Going straight
    Maryna Shulzhenko
    American traders say: “Trend is your friend”, which means “Trend is your friend”. And indeed it is! By trading with the trend, you reduce your risks and gain an advantage, as you increase the mathematical expectation of completed trades and, therefore, earn more profit. Together with the Going straight indicator you will trade with the trend with ease! This is one of the most effective ways to deal with market trends. Trading strategies using the channel indicator belong to the classic methods
    Check out other great products from  https://www.mql5.com/en/users/augustinekamatu/seller   This indicator is the best so far at estimating reversal points especially on high time frames. It does not repaint and is based on a combination of moving averages computed using custom functions. No inputs required, it is simple plug and play. The principles used ensure that it can be used on CFDs, Commodities and Stock with incredibly great results. With proper money management and portfolio balancing
    FREE
    Stochastic Arrow
    Anton Iudakov
    4.5 (4)
    The indicator has combined 5 popular strategies. Draws an arrow after confirming a signal for the selected strategy. There are signal alerts. Doesn't redraw its values. I recommend watching my advisor -   Night Zen EA 5 strategies. The main line crosses the signal line. The main line crosses the signal line in the oversold (for buy) / overbought (for sell) zones. The main line enters the oversold (for sell) / overbought (for buy) zones . The main line comes out of the oversold (for buy ) / over
    FREE
    CISD and Price Gap Openings Indicator MT4 The CISD CSD + Price Gap Openings Indicator is designed to highlight price gaps while marking the CISD level, providing insights into potential market reversals. This MetaTrader 4 tool, based on ICT principles, utilizes arrow markers to assist traders in recognizing fresh price gaps and possible retracement zones.   CISD – CSD + Price Gap Openings Indicator Specifications The following table outlines the features of the CISD – CSD + Price Gap Openings In
    FREE
    AlphaTrend AM
    Andriy Matviyevs'kyy
    The presented indicator, based on the volatility readings of a financial instrument plots dynamic S/R levels on the price chart. The indicator determines the trend and points to possible entry points formed by local highs/lows. The indicator allows you to notify the user of its signals by sending messages to the terminal and e-mail. The indicator does not repaint or recalculate. Signals when working with the indicator: The appearance of a red arrow above the price chart is a possible start of a
    FREE
    ON Trend
    Abdullah Alrai
    5 (1)
    Domine o poder do trading de tendências Este indicador foi projetado para traders de todos os níveis: iniciantes, intermediários e profissionais. Ele simplifica o processo de negociação ao identificar com precisão a tendência real em qualquer par de moedas. Por que escolher este indicador? - Negociação fácil: Não é mais necessário realizar análises complicadas. Basta carregar o indicador no gráfico, esperar pelos sinais de compra ou venda, e esquecer de ficar grudado na tela o dia todo. - Si
    FREE
    Keltner Channel MT4
    Muhammad Robith
    4.71 (7)
    Keltner Channel is a well known indicator that not in MT4's indicators default lineup (You can get this from your broker somehow). This indicator helps you to define trend and sometimes overbought/oversold prices during flat trend. Input Description: EMAperiod: Moving Average period used for indicator. Must be higher than 1. ATRperiod: Average True Range period used for indicator. Must be higher than 1. multiplier: Multiplier used for determine channel's wide. Must be higher than 0 but may not b
    FREE
    AWTime Indicator
    Komang Putra Riswanjaya
    Overview The Time Trading Indicator AWT is designed for traders who often miss or overlook their trading opportunities. This tool helps users stay on top of their trading windows by providing timely alerts. Key Features User-friendly interface: Simple and intuitive design for easy navigation. Easy to use:   Set it up quickly and start receiving notifications instantly. Alert and Push Notifications:   Stay informed with real-time alerts and push notifications. Customizable Objects:   Adjust the
    FREE
    Tin
    Maryna Shulzhenko
    The Tin indicator is designed to visually display the current trend in the market. One of the key aspects of foreign exchange market analysis is to determine the trend, which is the sustainable direction of price movement. To do this, the Tin indicator uses algorithms that smooth out sharp fluctuations that do not have a significant impact on the overall trend. A trend can be either upward (bullish) or downward (bearish). Typically, a trend persists for a long time before abruptly changing dir
    Signals and Alerts for Accelerator/Decelerator indicator based on these MQL5 posts: Accelerator Oscillator and Signals of the Indicator Accelerator Oscillator . Note : this tool is based on the code of Accelerator indicator developed by MetaQuotes Software Corp. Features The signals are triggered at   closing   of last bar/opening of a new bar; Any kind of alerts can be enabled: Dialog Box, Email message, SMS notifications for smartphones and tablets, and Sound alerts; Customizable arrows. By d
    FREE
    Dark Point
    Marco Solito
    4.83 (316)
    Dark Point  is an Indicator for intraday trading. This Indicator is based on   Trend Following  strategy, also adopting the use of the atr to determine the right volatility. We can enter in good price with this Indicator, in order to follow the   strong trend   on the current instrument. If you love Dark Point, consider adding some power: Dark Power Key benefits Easily visible take profit/stop loss lines Intuitive directional points/arrows by colors Useful statistics , which indicate the win ra
    FREE
    A ratio between 0 and 1 with the higher values representing a more efficient or trending market,  It is used in the calculation of Perry J. Kaufman Adaptive Moving Average (KAMA), dividing the price change over a period by the absolute sum of the price movements that occurred to achieve that change. The Fractal Efficiency or also known as Efficiency Ratio was first published by Perry J. Kaufman in his book ‘Smarter Trading‘. This is mostly considered a filter for volatile markets none the less
    FREE
    Market Profile 3
    Hussien Abdeltwab Hussien Ryad
    3 (2)
    Market Profile 3 MetaTrader 4 indicator  — is a classic Market Profile implementation that can show the price density over time, outlining the most important price levels, value area, and control value of a given trading session. This indicator can be attached to timeframes between M1 and D1 and will show the Market Profile for daily, weekly, monthly, or even intraday sessions. Lower timeframes offer higher precision. Higher timeframes are recommended for better visibility. It is also possible t
    FREE
    YK Find Support And Resistance
    Peechanat Chatsermsak
    5 (1)
    The " YK Find Support And Resistance " indicator is a technical analysis tool used to identify key support and resistance levels on a price chart. Its features and functions are as follows: 1. Displays support and resistance levels using arrow lines and colored bands, with resistance in red and support in green. 2. Can be adjusted to calculate and display results from a specified timeframe using the forced_tf variable. If set to 0, it will use the current timeframe of the chart. 3. Uses the
    FREE
    O indicador Crypto_Forex "Auto FIBO Pro" é uma ótima ferramenta auxiliar na negociação! - O indicador calcula e coloca automaticamente no gráfico os níveis de Fibonacci e as linhas de tendência locais (cor vermelha). - Os níveis de Fibonacci indicam áreas-chave onde o preço pode reverter. - Os níveis mais importantes são 23,6%, 38,2%, 50% e 61,8%. - Pode utilizá-lo para scalping de reversão ou para negociação de grelha de zona. - Existem muitas oportunidades para melhorar o seu sistema atual u
    Os compradores deste produto também adquirem
    Gann Made Easy
    Oleg Rodin
    4.81 (132)
    Gann Made Easy é um sistema de negociação Forex profissional e fácil de usar, baseado nos melhores princípios de negociação usando a teoria do sr. W. D. Gann. O indicador fornece sinais precisos de COMPRA e VENDA, incluindo níveis de Stop Loss e Take Profit. Você pode negociar mesmo em movimento usando notificações PUSH. Entre em contato comigo após a compra! Vou compartilhar minhas dicas de negociação com você e ótimos indicadores de bônus de graça! Provavelmente você já ouviu muitas vezes sobr
    M1 Sniper
    Oleg Rodin
    5 (5)
    O M1 SNIPER é um sistema indicador de negociação fácil de usar. É um indicador de seta projetado para o período M1. O indicador pode ser usado como um sistema independente para scalping no período M1 e pode ser usado como parte do seu sistema de negociação existente. Embora este sistema de negociação tenha sido projetado especificamente para negociação no M1, ele também pode ser usado em outros períodos. Originalmente, desenvolvi este método para negociar XAUUSD e BTCUSD. Mas considero-o útil ta
    Cycle Maestro
    Stefano Frisetti
    NEGOCIAÇÃO com CYCLEMAESTRO O sinal é simples e imediato: assim que o fundo de uma área fica verde ou vermelho, significa que um sinal de NEGOCIAÇÃO está ativo: VERDE = COMPRA e VERMELHO = VENDA. O TRADER pode abrir a NEGOCIAÇÃO e seguir as próximas instruções.  OBSERVAÇÃO: O CYCLEMAESTRO é distribuído apenas neste site, não há outros distribuidores. A versão DEMO é apenas para referência e não é suportada. A versão final é suportada e funciona perfeitamente. CYCLEMAESTRO, o primeiro e únic
    Dynamic Forex28 Navigator
    Bernhard Schweigert
    5 (5)
    Dynamic Forex28 Navigator - A ferramenta de negociação Forex de última geração. ATUALMENTE 49% DE DESCONTO. Dynamic Forex28 Navigator é a evolução dos nossos indicadores populares de longa data, combinando o poder de três em um: Indicador Advanced Currency Strength28 (695 avaliações) + Advanced Currency IMPULSE com ALERTA (520 avaliações) + Sinais CS28 Combo (Bônus). Detalhes sobre o indicador https://www.mql5.com/en/blogs/post/758844 O que o Next-Generation Strength Indicator oferece?  Tudo
    Scalper Inside PRO
    Alexey Minkov
    4.74 (66)
    An exclusive indicator that utilizes an innovative algorithm to swiftly and accurately determine the market trend. The indicator automatically calculates opening, closing, and profit levels, providing detailed trading statistics. With these features, you can choose the most appropriate trading instrument for the current market conditions. Additionally, you can easily integrate your own arrow indicators into Scalper Inside Pro to quickly evaluate their statistics and profitability. Scalper Inside
    Algo Pumping MT4
    Ihor Otkydach
    4.92 (12)
    PUMPING STATION – Sua estratégia pessoal “tudo incluído” Apresentamos o PUMPING STATION — um indicador revolucionário para Forex que vai transformar sua maneira de operar em uma experiência empolgante e eficaz. Este não é apenas um assistente, mas sim um sistema de trading completo com algoritmos poderosos que vão te ajudar a operar de forma mais estável. Ao adquirir este produto, você recebe GRATUITAMENTE: Arquivos de configuração exclusivos: para uma configuração automática e desempenho máximo
    Claro, aqui está a tradução para o português: Apresentando o Indicador de Astronomia para MT4: Seu Companheiro Celestial Definitivo no Trading Você está pronto para elevar sua experiência de trading a alturas celestiais? Não procure mais do que o nosso revolucionário Indicador de Astronomia para MT4. Essa ferramenta inovadora transcende os indicadores de trading tradicionais, aproveitando o poder de algoritmos complexos para fornecer insights astronômicos incomparáveis e cálculos de precisão. Um
    Trend Screener
    STE S.S.COMPANY
    4.79 (94)
    Indicador de tendência, solução única inovadora para negociação e filtragem de tendências com todos os recursos de tendências importantes construídos dentro de uma ferramenta! É um indicador multi-timeframe e multi-moedas 100% sem repintura que pode ser usado em todos os símbolos/instrumentos: forex, commodities, criptomoedas, índices e ações. OFERTA POR TEMPO LIMITADO: O indicador Support and Resistance Screener está disponível por apenas US$ 50e vitalício. (Preço original US$ 250) (oferta este
    O sistema PRO Renko é um sistema de negociação altamente preciso especialmente concebido para a negociação de gráficos RENKO. Trata-se de um sistema universal que pode ser aplicado a vários instrumentos de negociação. O sistema neutraliza eficazmente o chamado ruído de mercado, dando-lhe acesso a sinais de inversão precisos. O indicador é muito fácil de usar e tem apenas um parâmetro responsável pela geração de sinal. Você pode facilmente adaptar a ferramenta a qualquer instrumento de negocia
    Grabber System
    Ihor Otkydach
    5 (1)
    Apresento a você um excelente indicador técnico: Grabber, que funciona como uma estratégia de trading “tudo incluído”, pronta para usar. Em um único código estão integradas ferramentas poderosas de análise técnica de mercado, sinais de entrada (setas), funções de alertas e notificações push. Cada comprador deste indicador também recebe gratuitamente: Utilitário Grabber: ferramenta para gerenciamento automático de ordens abertas Vídeo tutorial passo a passo: como instalar, configurar e operar com
    True Direction Oscillator
    Muhammad Elbermawi
    4.86 (361)
    Ou (TDO) que é um índice que mede a taxa de variação do preço usando o princípio de " Pure Momentum ". Quando o preço de um título avança de 10 para 15, a taxa de variação do preço é 150%, mas quando diminui de 15 para 10, a taxa de variação do preço é apenas 33,3%. É por isso que os indicadores de análise técnica como "Taxa de variação do preço" (ROC) ou "Momentum" fornecem leituras mais altas para movimentos de preços ascendentes do que para os descendentes. O TDO corrige esse problema para aj
    Gold Stuff
    Vasiliy Strukov
    4.85 (262)
    Gold Stuff-um indicador de tendência projetado especificamente para o ouro, também pode ser usado em qualquer instrumento financeiro. O indicador não é redesenhado ou atrasado. O timeframe recomendado é H1. O EA Gold Stuff Expert Advisor está escrito neste indicador, você pode encontrá-lo no meu perfil. Importante! Entre em contato comigo imediatamente após a compra para obter instruções e bônus!  Você pode obter uma cópia gratuita do nosso indicador Strong Support e Trend Scanner, envie uma
    FX Volume
    Daniel Stein
    4.6 (35)
    FX Volume: Vivencie o Verdadeiro Sentimento de Mercado sob a Perspectiva de um Corretor Visão Geral Rápida Quer aprimorar sua abordagem de trading? FX Volume fornece insights em tempo real sobre como traders de varejo e corretores estão posicionados—bem antes de relatórios atrasados como o COT. Seja para buscar ganhos consistentes ou simplesmente ter uma vantagem mais clara no mercado, FX Volume ajuda você a detectar grandes desequilíbrios, confirmar rompimentos e aperfeiçoar sua gestão de ris
    Descubra o segredo da negociação forex bem -sucedida com nosso indicador MT4 personalizado! Você já se perguntou como obter sucesso no mercado de Forex, obtendo lucros consistentemente e minimizando o risco? Aqui está a resposta que você está procurando! Permita -nos apresentar nosso indicador proprietário do MT4 que revolucionará sua abordagem à negociação. Versatilidade única Nosso indicador foi projetado especialmente para usuários que preferem as formações de vela Renko e Rangebar. Entende
    Quantum Profile System  —   is a comprehensive professional trading system with advanced algorithms. It combines trend direction analysis, volume concentration at key levels, dynamic adaptation to market volatility, and signal generation without delays or repainting. Quantum Profile System integrates the functionality of a volume profile based on linear regression with an adaptive trend channel using ATR. It features volume profiles with construction and display in two directions. Multi-level v
    PZ Trend Trading
    PZ TRADING SLU
    4.8 (5)
    O Trend Trading é um indicador projetado para lucrar o máximo possível com as tendências que ocorrem no mercado, cronometrando retrocessos e rupturas. Ele encontra oportunidades de negociação analisando o que o preço está fazendo durante as tendências estabelecidas. [ Guia de instalação | Guia de atualização | Solução de problemas | FAQ | Todos os produtos ] Negocie mercados financeiros com confiança e eficiência Lucre com as tendências estabelecidas sem ser chicoteado Reconhecer retrocessos
    Currency Strength Exotics
    Bernhard Schweigert
    4.88 (32)
    ACTUALMENTE 20% DE DESCONTO ! A melhor solução para qualquer novato ou comerciante especializado! Este Indicador é especializado para mostrar a força da moeda para quaisquer símbolos como Pares Exóticos de Commodities, Índices ou Futuros. É o primeiro do seu género, qualquer símbolo pode ser adicionado à 9ª linha para mostrar a verdadeira força da moeda de Ouro, Prata, Petróleo, DAX, US30, MXN, TRY, CNH etc. Esta é uma ferramenta de negociação única, de alta qualidade e acessível, porque inco
    ACTUALMENTE 31% DE DESCONTO!! A melhor solução para qualquer novato ou comerciante especializado! Este indicador é uma ferramenta comercial única, de alta qualidade e acessível, porque incorporámos uma série de características proprietárias e uma fórmula secreta. Com apenas UM gráfico, dá alertas para todos os 28 pares de moedas. Imagine como a sua negociação irá melhorar porque é capaz de identificar o ponto exacto de desencadeamento de uma nova tendência ou oportunidade de escalada! Constr
    FX Power MT4 NG
    Daniel Stein
    4.94 (18)
    FX Power: Analise a Força das Moedas para Decisões de Negociação Mais Inteligentes Visão Geral FX Power é a sua ferramenta essencial para compreender a força real das principais moedas e do ouro em quaisquer condições de mercado. Identificando moedas fortes para comprar e fracas para vender, FX Power simplifica as decisões de negociação e revela oportunidades de alta probabilidade. Quer você prefira seguir tendências ou antecipar reversões usando valores extremos de Delta, esta ferramenta adap
    TPSproTREND PrO
    Roman Podpora
    4.68 (25)
    VERSION MT5        —        ИНСТРУКЦИЯ RUS           —        INSTRUCTIONS  ENG Principais funções: Sinais de entrada precisos SEM RENDERIZAÇÃO! Se aparecer um sinal, ele permanece relevante! Esta é uma diferença importante em relação aos indicadores de redesenho, que podem fornecer um sinal e depois alterá-lo, o que pode levar à perda de fundos depositados. Agora você pode entrar no mercado com maior probabilidade e precisão. Também existe a função de colorir as velas após o aparecimento da se
    Stratos Pali
    Michela Russo
    5 (3)
    Stratos Pali Indicator   is a revolutionary tool designed to enhance your trading strategy by accurately identifying market trends. This sophisticated indicator uses a unique algorithm to generate a complete histogram, which records when the trend is Long or Short. When a trend reversal occurs, an arrow appears, indicating the new direction of the trend. Important Information Revealed Leave a review and contact me via mql5 message to receive My Top 5 set files for Stratos Pali at no cost! Dow
    Volatility Trend System - um sistema de negociação que dá sinais para entradas. O sistema de volatilidade fornece sinais lineares e pontuais na direção da tendência, bem como sinais para sair dela, sem redesenho e atrasos. O indicador de tendência monitora a direção da tendência de médio prazo, mostra a direção e sua mudança. O indicador de sinal é baseado em mudanças na volatilidade e mostra entradas no mercado. O indicador está equipado com vários tipos de alertas. Pode ser aplicado a vários i
    Dark Absolute Trend
    Marco Solito
    4.58 (40)
    Dark Absolute Trend   is an Indicator for intraday trading. This Indicator is based on Trend Following  strategy but use also candlestick patterns and Volatility. We can enter in good price with this Indicator, in order to follow the main trend on the current instrument. It is advised to use low spread ECN brokers. This Indicator does Not repaint and N ot lag . Recommended timeframes are M5, M15 and H1. Recommended working pairs: All. I nstallation and  Update Guide   -  Troubleshooting guide  
    Bermaui Deviation Percent
    Muhammad Elbermawi
    4.94 (111)
    Ou (BD%), que é um índice de volatilidade que mede a volatilidade em porcentagem ao invés de pontos. A ideia do BD% é fazer um índice dependendo do Desvio Padrão Clássico (CSD) que se move entre 0 e 100 por cento. Você pode usar BD% para comparar a volatilidade do mesmo título em diferentes períodos de tempo ou intervalos de tempo diferentes. Além disso, você pode usar BD% para comparar a volatilidade entre diferentes títulos em diferentes mercados em termos de porcentagem, em vez de pontos.
    ACTUALMENTE 20% DE DESCONTO ! A melhor solução para qualquer novato ou comerciante especializado! Este Indicador é uma ferramenta de negociação acessível porque incorporámos uma série de características proprietárias juntamente com uma nova fórmula. O Indicador Avançado de Volume de Moeda Acumulado é especializado para os principais 28 pares de Forex e funciona em todos os períodos de tempo. É uma nova fórmula que num único gráfico extrai todo o volume de moeda (C-Volume) de AUD, CAD, CHF, E
    FX Levels MT4
    Daniel Stein
    5 (2)
    FX Levels: Suporte e Resistência com Precisão Excepcional para Todos os Mercados Visão Geral Rápida Procurando um meio confiável de identificar níveis de suporte e resistência em qualquer mercado—incluindo pares de moedas, índices, ações ou commodities? FX Levels combina o método “Lighthouse” tradicional com uma abordagem dinâmica de vanguarda, fornecendo uma precisão quase universal. Baseado em nossa experiência real com corretores e em atualizações automáticas diárias mais as de tempo real,
    Daily Candle Predictor é um indicador que prevê o preço de fechamento de uma vela. O indicador destina-se principalmente ao uso em gráficos D1. Este indicador é adequado tanto para negociação forex tradicional quanto para negociação de opções binárias. O indicador pode ser usado como um sistema de negociação autônomo ou pode atuar como um complemento ao seu sistema de negociação existente. Este indicador analisa a vela atual, calculando certos fatores de força dentro do próprio corpo da vela, be
    TPSpro RFI Levels
    Roman Podpora
    4.85 (27)
    Zonas de reversão / Volumes de pico / Zonas ativas de um grande player =       SISTEMA TS TPSPRO INSTRUÇÕES RUS       /       INSTRUÇÕES       ENG       /       Version MT5 Cada comprador deste indicador recebe adicionalmente GRATUITAMENTE: 6 meses de acesso aos sinais de negociação do serviço RFI SIGNALS - pontos de entrada prontos de acordo com o algoritmo TPSproSYSTEM. Materiais de treinamento com atualizações regulares - mergulhe na estratégia e aumente seu nível profissional. Suporte 24 h
    Black dragon indicator
    Ramil Minniakhmetov
    4.81 (121)
    O indicador de detecção de tendências complementará qualquer estratégia e também pode ser usado como uma ferramenta independente. Recomendações para trabalhar com o indicador, você pode baixar no comentário #8 Vantagens Fácil de usar, não sobrecarrega o gráfico com informações desnecessárias; Pode ser usado como filtro para qualquer estratégia; Possui níveis integrados de suporte e resistência dinâmicos, que podem ser usados ​​tanto para fins de lucro quanto para definir stop-loss; O indicad
    Cycle Sniper
    Elmira Memish
    4.39 (36)
    NEW YEAR SALE PRICE FOR LIMITED TIME!!! Please contact us after your purchase and we will send you the complimentary indicators to complete the system Cycle Sniper is not a holy grail but when you use it in a system which is explained in the videos, you will feel the difference. If you are not willing to focus on the charts designed with Cycle Sniper and other free tools we provide, we recommend not buying this indicator. We recommend watching the videos about the indiactor and system before pu
    Mais do autor
    Step RSI AM
    Andriy Matviyevs'kyy
    5 (2)
    O indicador apresentado é um desenvolvimento original baseado no indicador clássico de análise técnica - RSI. Para suavizar as flutuações bruscas nos valores dos indicadores, é utilizado um filtro que corta as mudanças fracas e concentra a atenção do trader nas flutuações fortes dos valores. O indicador não repinta em barras formadas. Para uma maior eficácia deste indicador, deve ser utilizado em conjunto com indicadores que identifiquem a direção da tendência, bem como os níveis de suporte/resi
    FREE
    Fine Trade AM
    Andriy Matviyevs'kyy
    5 (1)
    O indicador apresentado avalia a volatilidade de um instrumento financeiro e com elevada eficiência emite sinais sobre momentos de alterações significativas na direção do movimento dos preços. O indicador é intuitivo e fácil de utilizar. O sinal indicador é gerado após a conclusão da formação da barra, na qual o indicador muda a sua posição em relação a zero. O indicador nunca redesenha o sinal. Os sinais do indicador devem ser confirmados pelo preço que excede o máximo/mínimo da barra na qual o
    FREE
    ADX Line AM
    Andriy Matviyevs'kyy
    4.75 (4)
    This indicator, interpreting ADX and ATR data, clearly and accurately identifies the current trend, allowing the trader to get the most out of strong price movements. The indicator is intuitive to use: a change in line direction means a change in trend direction; a change in line color warns of an imminent change in direction. The indicator does not repaint and allows you to send notifications about its signals to a mobile terminal and email. Configurable parameters: ADX_Medium_Coefficient - the
    FREE
    EasyTrend AM
    Andriy Matviyevs'kyy
    5 (1)
    The presented product is a trend indicator of technical analysis that allows you to open a position at the very beginning of a significant price movement. The most important qualities of the presented indicator are: The ability to follow the trend for as long as possible to get all the potential profit; Minimization of potential losses in case of a trend reversal or significant correction. The indicator has a wide range of customizable parameters allowing it to be used effectively in any market
    FREE
    RSI Cross Signal AM
    Andriy Matviyevs'kyy
    The indicator gives signals to open/close a position and marks them on the price chart of the financial instrument. The signals differ in their potential, which allows you to decide on the amount of risk in each transaction. The principle of operation is to compare the current RSI value with the RSI value whose period is multiplied by the Cross_Factor value. The signal is confirmed when the price overcomes the maximum/minimum of the bar on which the indicator gave the signal. The open position i
    FREE
    Double PSAR AM
    Andriy Matviyevs'kyy
    5 (1)
    This indicator is the author's implementation of the classic indicator Parabolic Support and Resist (PSAR). A time-tested product that allows you to not only determine entry/exit points but also reasonable levels for setting protective stop orders. The indicator has two customizable ranges, which allows you to identify long-term and short-term trends. The indicator does not repaint on the data history. The indicator has the ability to give signals and send notifications about them to e-mail and
    FREE
    MFI Signal AM
    Andriy Matviyevs'kyy
    5 (1)
    This indicator displays signals on the price chart based on the data of the classic indicator - the Money Flow Index (MFI). The volume is taken into account when calculating the MFI values. MFI can be used to determine overbought or oversold zones in the market. This indicator allows you to display three types of signals on the price chart: MFI exit from the overbought or oversold zone; MFI entry into the overbought or oversold zone; MFI crossing the middle between the overbought and oversold zo
    FREE
    ADX Signal AM
    Andriy Matviyevs'kyy
    4.67 (3)
    This indicator is an interpretation of the Average Directional Movement Index (ADX), which helps to determine the presence of a price trend. It was developed and described in detail in the book "New Concepts in Technical Trading Systems" by Welles Wilder. The presented indicator displays signals on the price chart when +DI and -DI cross and signals when the ADX value falls or rises in relation to the mutual arrangement of +DI and -DI. The indicator's buy signals also work as a support level, whi
    FREE
    SuperTrend AM
    Andriy Matviyevs'kyy
    5 (1)
    The presented product is a trend indicator of technical analysis that builds dynamic support/resistance levels based on the volatility of a financial instrument. The indicator allows you to determine the entry points into the market at the moment the price overcomes dynamic support/resistance level and to set a reasonable level for fixing a loss/profit. The indicator is a simple and effective tool that (depending on the parameter settings) can be used in almost any market and for any trading st
    FREE
    ADX Trigger AM
    Andriy Matviyevs'kyy
    5 (1)
    This indicator is an interpretation of the Average Directional Movement Index (ADX), which helps to determine the presence of a price trend. It was developed and described in detail in the book "New Concepts in Technical Trading Systems" by Welles Wilder. The indicator determines entry points into the market, using the intersection of the +/- lines of the ADX indicator as a signal, as well as the rise or fall of the main line of the ADX indicator. Crossing the zero line by the indicator indicate
    FREE
    DSS Oscillator AM
    Andriy Matviyevs'kyy
    The presented indicator is the author's implementation of the Double Smoothed Stochastic oscillator developed by William Blau and Walter Bressert. The calculation of values ​​is in many ways similar to the calculation of the classic stochastic oscillator. The indicator takes into account the location of the current price relative to local highs/lows. The indicator gives signals about changing its direction and/or about entering/exiting the overbought/oversold zone. The signal is given after the
    FREE
    Limit Levels AM
    Andriy Matviyevs'kyy
    The presented indicator sets dynamic support/resistance levels on the price chart. The indicator is easy to use and can be useful for both beginners and professional traders. The middle line of the indicator (Central level) helps to identify the current trend: If the closing price is above the central line - the trend is ascending. If the closing price is below the central line - the trend is descending. The presented indicator allows implementing another version of the trading strategy, which w
    FREE
    Simple Trend AM
    Andriy Matviyevs'kyy
    The trend is your friend. A simple truth known to every trader. The presented indicator allows you to visualize the current trend. The indicator identifies the trend using the following definition as an algorithm: A trend is a situation when each subsequent maximum price rise is higher/lower than the previous one, and similarly each subsequent maximum price fall is higher/lower than the previous one; The beginning of a new trend is considered to be when the current maximum/minimum overcomes all
    FREE
    Fractal Levels AM
    Andriy Matviyevs'kyy
    The presented indicator is an original development based on the idea embedded in the classic technical analysis indicator - Fractals. The Fractals indicator allows you to determine a significant trough or peak for analysis on the price chart of the financial instrument in question. The fractal itself on the price chart consists of candles, the middle of which is either the highest (up fractal) or the lowest (down fractal) of all the candles taken for analysis. The original indicator uses five ca
    FREE
    TTF Line AM
    Andriy Matviyevs'kyy
    The presented indicator draws a trend line and points of change in its direction on the price chart based on the TTF (Trend Trigger Factors) and ATR indicators. The indicator advantageously combines ease of use, speed of reaction to a change in trend direction and reliability of signals. The indicator is intuitive to use: Change in line direction - change in trend direction; Change in line color warns of an imminent change in direction. The indicator does not repaint and allows you to send notif
    FREE
    ASC Signal AM
    Andriy Matviyevs'kyy
    A signal indicator marking buy/sell points. In this version, it is supplemented with optimal SL points. Recommended for use in conjunction with a trend indicator to filter signals. The indicator has only one adjustable parameter that determines its sensitivity, which greatly simplifies setting the indicator to the current market and the user's trading style. Indicator signals are given only after the full formation of the bar. The indicator can be used to trade any market. Its basic parameters p
    FREE
    HyperSignal AM
    Andriy Matviyevs'kyy
    The presented indicator is an original development. The indicator is designed for high-frequency short-term trading with maximum reinvestment of funds. The indicator gives signals to open/close a position. The indicator sensitivity can be adjusted in a literally infinite range, which allows it to be used for trading in any market. The indicator signals vary in strength depending on their consistency with the trend over three different time periods. The above indicator feature allows you to esti
    FREE
    RSI 4x Candles AM
    Andriy Matviyevs'kyy
    The presented indicator displays in the form of colored candles the signals of the intersections of four RSI indicators of different periods. The candle turns red when the values ​​of the first indicator are less than the values ​​of the second indicator and the values ​​of the third indicator are less than the values ​​of the fourth indicator. The candle turns blue when the values ​​of the first indicator are greater than the values ​​of the second indicator and the values ​​of the third indica
    FREE
    REI Oscillator AM
    Andriy Matviyevs'kyy
    The presented product is the author's implementation of the REI (Range Expansion Index) indicator developed by Thomas DeMark. REI Oscillator AM is an indicator that measures the rate of price change and signals overbought/oversold conditions if the price shows weakness or strength. The indicator value changes within the range from -100 to +100. Thomas DeMark suggests using the default period of 8 and the following algorithm for using the indicator: When the price rises above level 60 and then fa
    FREE
    AlphaTrend AM
    Andriy Matviyevs'kyy
    The presented indicator, based on the volatility readings of a financial instrument plots dynamic S/R levels on the price chart. The indicator determines the trend and points to possible entry points formed by local highs/lows. The indicator allows you to notify the user of its signals by sending messages to the terminal and e-mail. The indicator does not repaint or recalculate. Signals when working with the indicator: The appearance of a red arrow above the price chart is a possible start of a
    FREE
    Deep River AM
    Andriy Matviyevs'kyy
    The presented indicator is the author's implementation of the classic trading idea: Moving averages of different periods diverge over time on a strengthening trend and converge on a weakening trend. The proposed product allows you to clearly demonstrate: The direction of price movement; Temporary price rollbacks; Zones of multidirectional price movement. Namely: The indicator lines go up and diverge from each other - a strong bullish trend; The indicator lines go down and diverge from each othe
    FREE
    DSS Candles AM
    Andriy Matviyevs'kyy
    5 (1)
    This indicator colors the price chart candles according to the data of the DSS Oscillator AM indicator. DSS Oscillator AM is the author's implementation of the Double Smoothed Stochastic oscillator developed by William Blau and Walter Bressert. The calculation of values ​​is largely similar to the calculation of the classic stochastic oscillator. The indicator takes into account the location of the current price relative to local highs/lows. The signal about the change in the direction of price
    FREE
    Bulls or Bears AM
    Andriy Matviyevs'kyy
    5 (1)
    The presented indicator implements the idea embedded in the classic technical analysis indicators - "Bulls" / "Bears" at a new level. The "Bulls or Bears AM" indicator displays the difference between the maximum and minimum prices for the current period of time and the values ​​of the channel built on the maximum and minimum prices for a longer period. The growth of the indicator values ​​above zero indicates that the maximum price for the current period is greater than the average value of maxi
    Market Pulse AM
    Andriy Matviyevs'kyy
    5 (1)
    The presented indicator analyzes the direction of the short-term and long-term trend for specified periods, taking into account the volatility of the market. This approach allows combining high sensitivity of the indicator with a high probability of execution of its signals. The principle of use is extremely simple: the indicator histogram is greater than 0 - a buy signal / the indicator histogram is less than 0 - a sell signal. The indicator allows you to configure two types of parameters: fast
    Digital Arrows AM
    Andriy Matviyevs'kyy
    The presented technical analysis indicator marks the points on the price chart of a financial instrument at which the short-term/long-term trend has changed its direction. The indicator identifies the trend direction by analyzing the divergence of the price series with the data of the digital filter selected by the user. The ability of the applied digital filters to adapt to sharp price fluctuations allows achieving high efficiency of the indicator signals in most markets. The indicator signals
    Filtro:
    fxpat
    510
    fxpat 2021.05.27 11:29 
     

    O usuário não deixou nenhum comentário para sua avaliação

    Responder ao comentário
    Versão 30.10 2025.04.15
    Updated.
    Versão 30.0 2025.04.15
    Updated.
    Versão 26.0 2023.09.15
    Updated to version 26+.
    Versão 25.0 2023.08.11
    Updated to version 25+.
    Versão 5.0 2023.07.04
    Updated.
    Versão 4.0 2016.06.21
    Revised the code.
    Added auto correction of invalid settings.
    Versão 2.0 2016.05.04
    The description added to the indicator code.
    Versão 1.4 2015.07.21
    Fixed display of a limited amount of candles.
    Fixed checking the indicator calculation data sufficiency.
    Versão 1.3 2015.06.01
    In the updated indicator version, the candlesticks, on which the indicator signal on a longer period conflicts with the signal on the shorter period, are painted in a gray color. The indicator values equal to zero are also colored in gray.