Swan Harmonic Pattern Indicator MT5
- Indicadores
- Eda Kaya
- Versão: 2.1
Swan Harmonic Pattern Indicator MT5
The Swan Harmonic Pattern Indicator identifies reversal patterns in both bullish and bearish market trends. This MT5 harmonic pattern tool helps detect potential reversal zones and anticipates future price movements in the forex market.
A key highlight of this indicator is its capability to represent two unique pattern variations: the Black Swan and the White Swan. To begin using the indicator, be sure to set the pip value according to your trading pair in the "Original pivot to broken pivot" field.
«Indicator Installation & User Guide»
MT5 Indicator Installation | Swan Harmonic Pattern Indicator MT4 | ALL Products By TradingFinderLab | Best MT5 Indicator: Refined Order Block Indicator for MT5 | Best MT5 Utility: Trade Assistant Expert TF MT5 | TP & SL Tool: Risk Reward Ratio Calculator RRR MT5 | Money Management: Easy Trade Manager MT5 | Trade Copier: Free Fast Local Trade Copier MT5 | Money management + prop protector: Trade Assist Prop Protector MT5
Swan Harmonic Pattern Indicator Specifications Table
Below is a table presenting the key specifications of the Swan Harmonic Pattern Indicator:
| Category | Harmonic Patterns – Candlestick – Classic & Chart Patterns |
| Platform | MetaTrader 5 |
| Skill Level | Intermediate |
| Indicator Type | Reversal |
| Timeframe | Multi timeframe |
| Trading Style | Intraday Trading |
| Markets | All Markets |
Swan Harmonic Pattern at a Glance
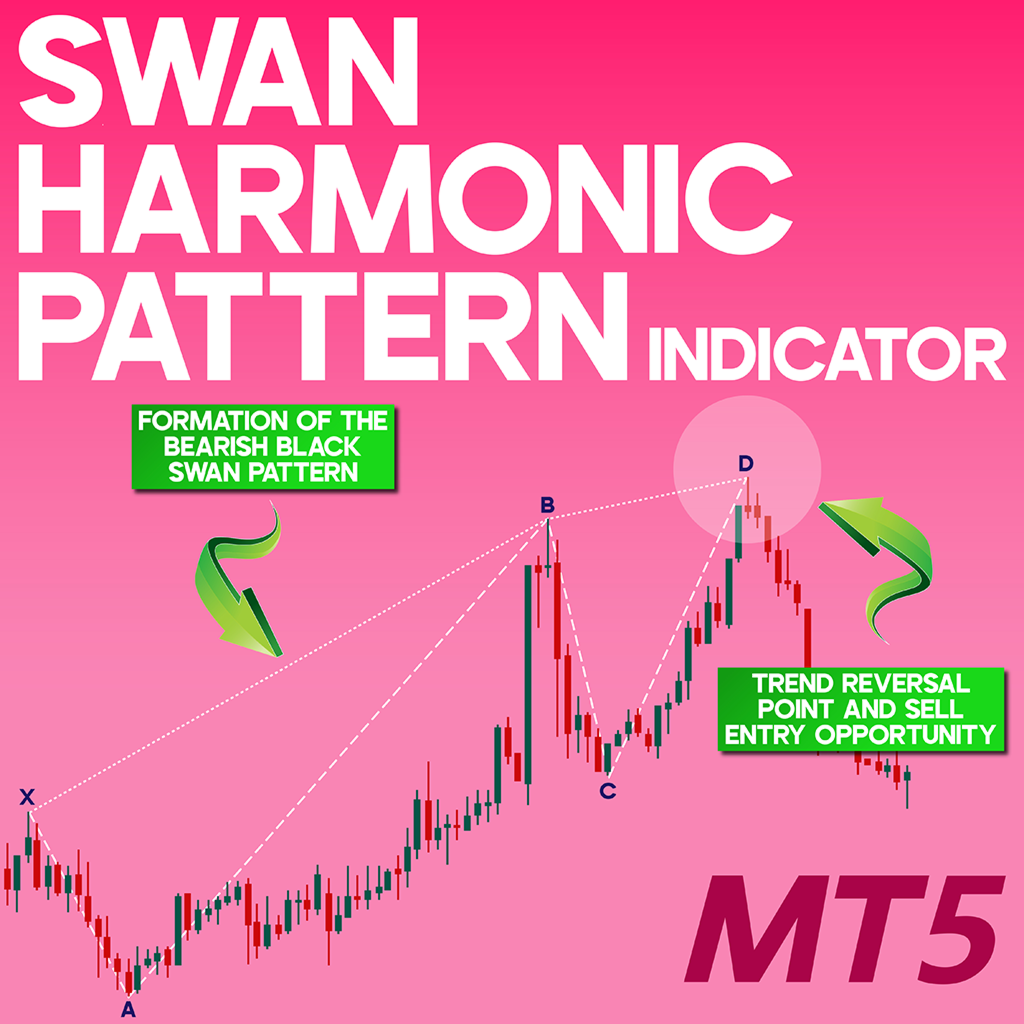
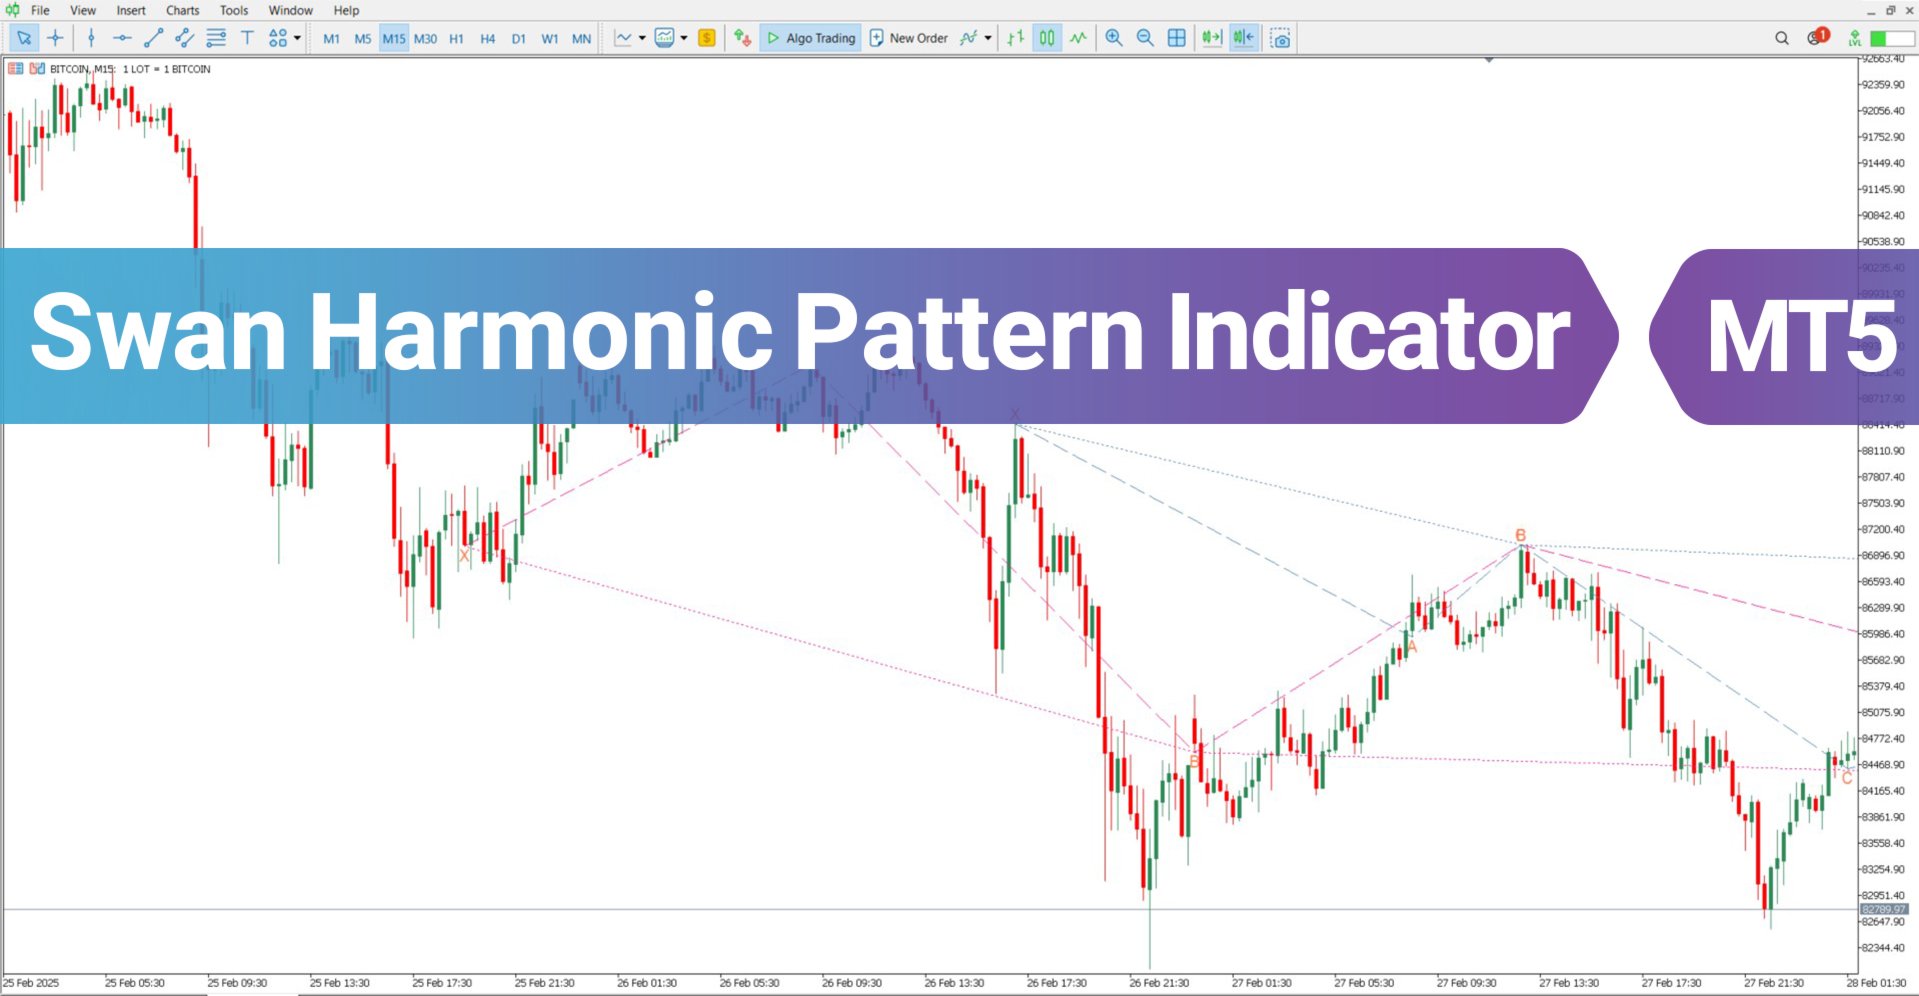
This harmonic pattern comprises five primary points: X, A, B, C, and D. It is used to pinpoint potential reversal levels, especially in volatile market conditions. Within the MetaTrader 5 platform, the indicator displays bullish Swan formations in pink and bearish ones in blue.
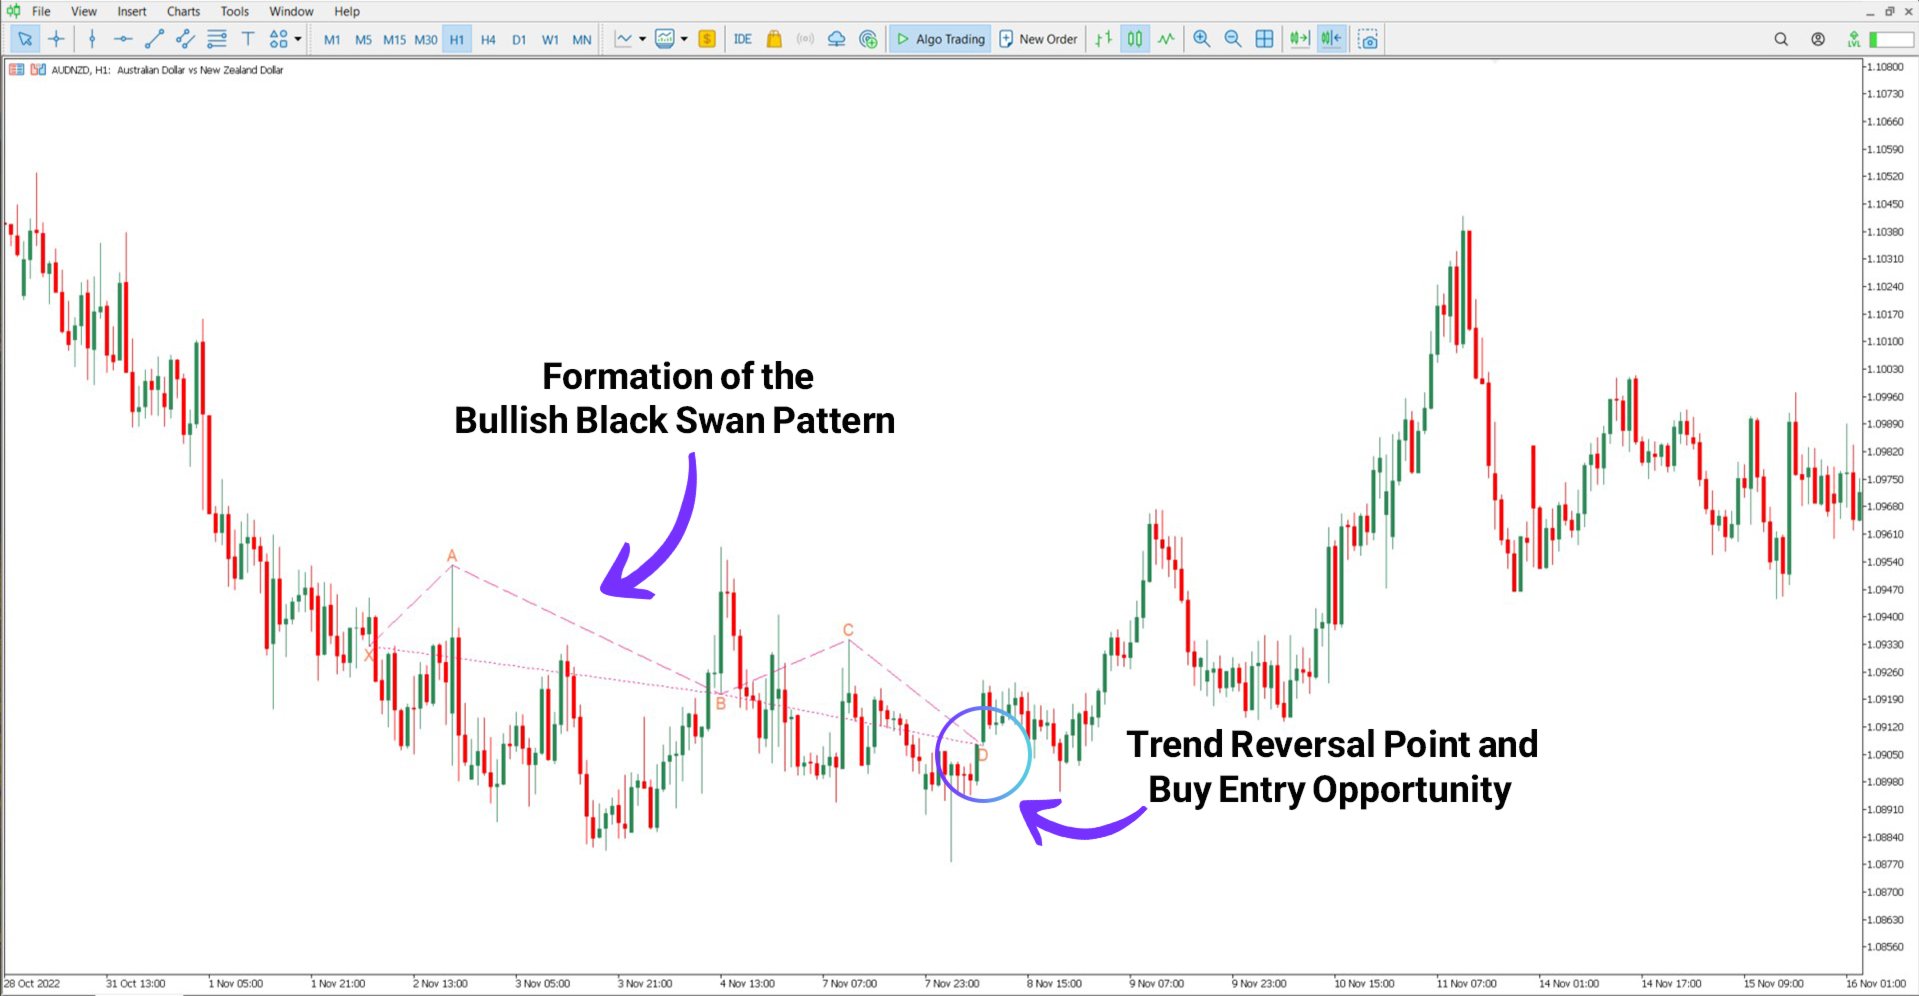
Bullish Swan Harmonic Pattern
On the one-hour chart of AUD/NZD, a pink-colored bullish Swan pattern appears. In this case, point "D" serves as the potential reversal level, creating a favorable opportunity for initiating Buy positions. The inverse form of this setup is referred to as the White Bullish Swan.
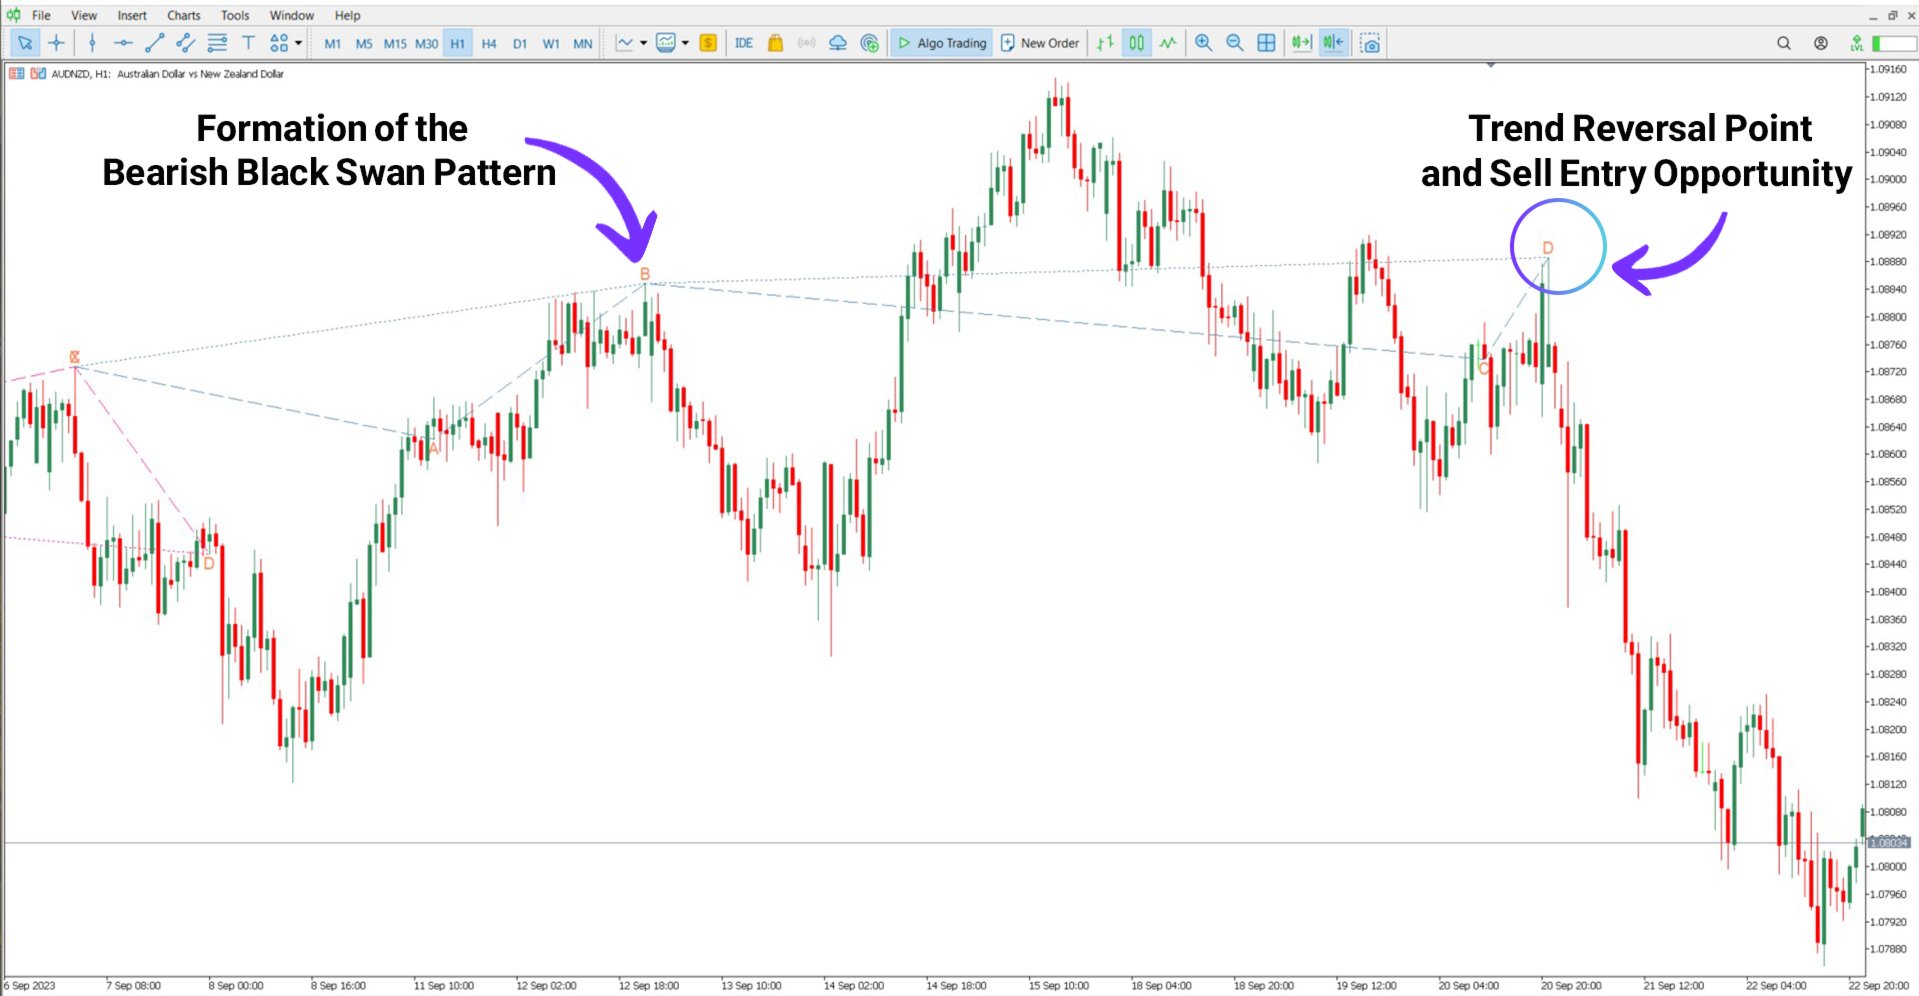
Bearish Swan Harmonic Pattern
As shown in the chart analysis, the indicator visualizes a Black Bearish Swan pattern. After the formation of point "D," the trend direction shifts downward, offering a signal for Sell entries. The pattern’s mirrored counterpart is known as the White Bearish Swan.
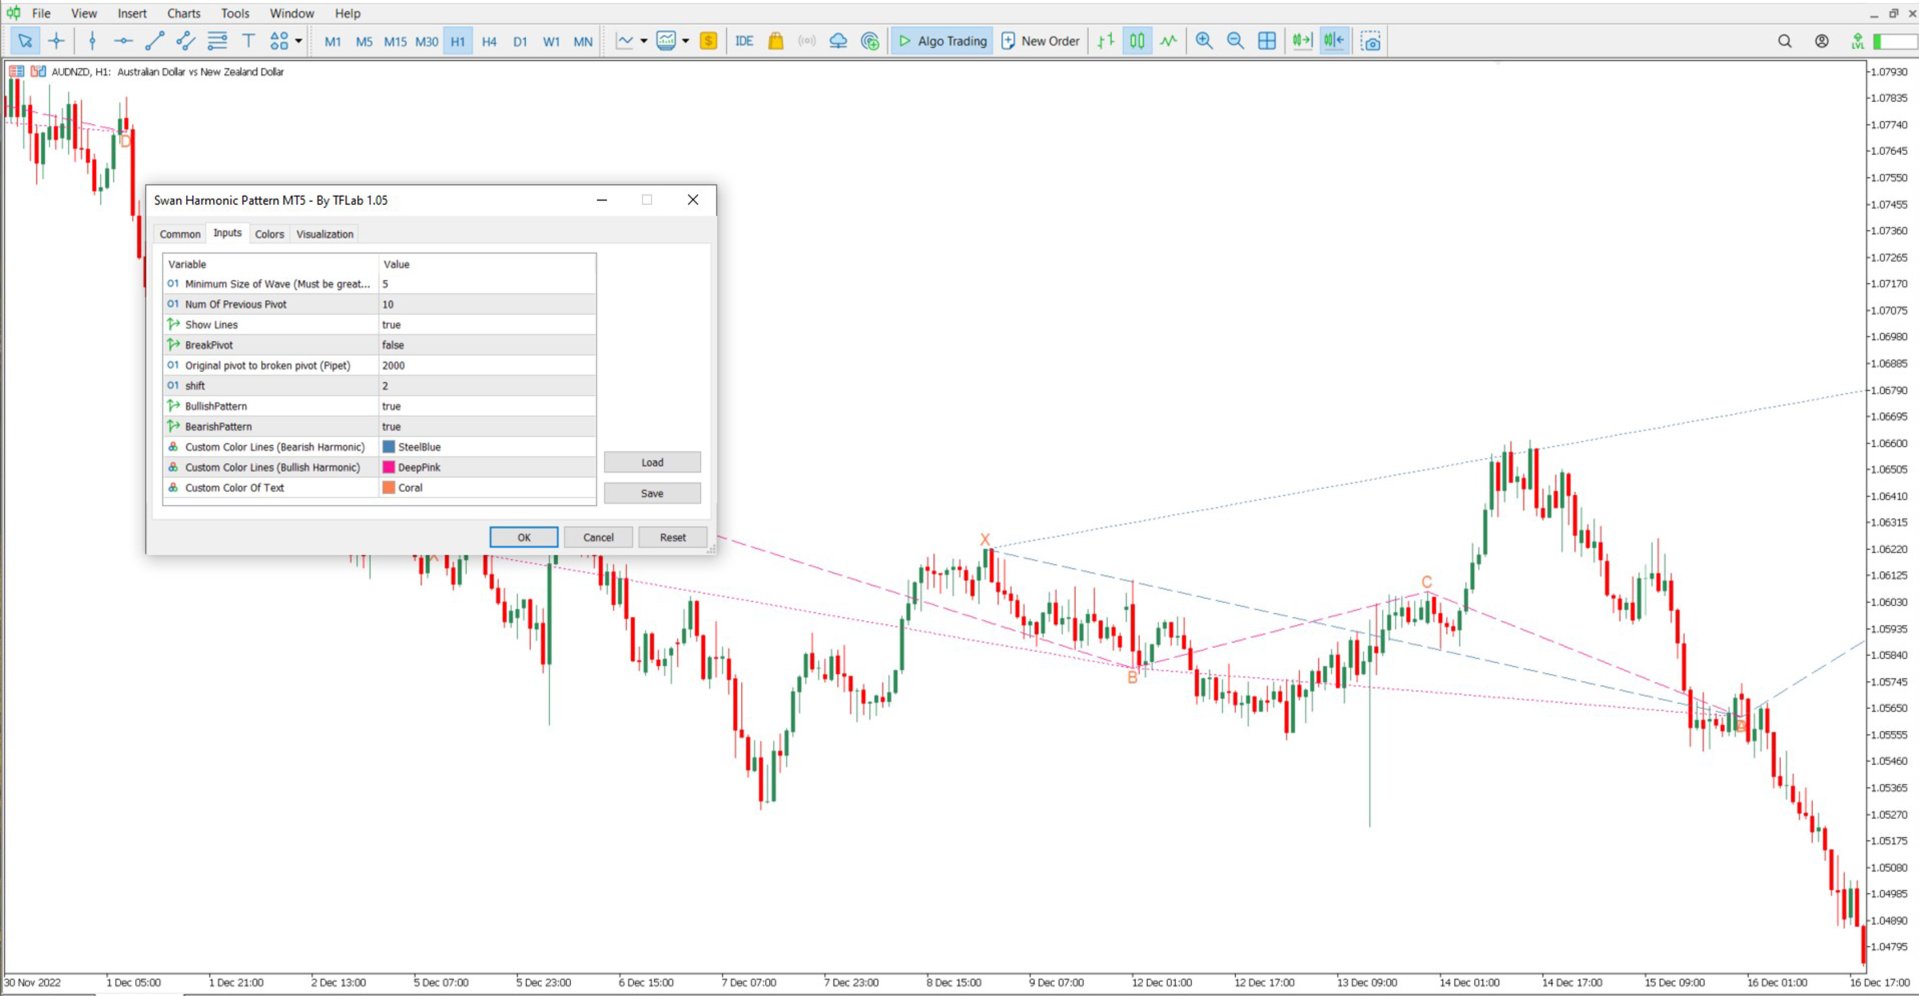
Swan Harmonic Pattern Indicator Settings
Below is an overview of the customizable options available within the Swan Harmonic Pattern Indicator:
• Minimum Length of Wave (Candle): Determines the minimum number of candles needed for pattern identification
• Num of Previous Candle: Number of past candles used in the pattern detection process
• Show Lines: Enables the visualization of the pattern’s structure
• Break Pivot: Activates conversion from original to broken pivot points
• Original Pivot to Broken Pivot (Pipet): Specifies the pip distance between original and broken pivot levels
• Shift: Adjusts the position of displayed data on the chart
• Bullish Pattern: Option to display bullish pattern formations
• Bearish Pattern: Option to display bearish pattern formations
• Custom Color Lines (Bearish Harmonic): Defines the color scheme for bearish harmonic lines
• Custom Color Lines (Bullish Harmonic): Defines the color scheme for bullish harmonic lines
• Custom Color of Text: Adjusts the color of chart labels and annotations
Conclusion
The Swan Harmonic Pattern Indicator serves as an effective tool for recognizing reversal patterns through the visual representation of Black and White Swan formations. As an MT5 candlestick-based indicator, it provides a range of customization options including internal parameter adjustments and unique color configurations.
It supports multi-timeframe analysis and is versatile enough for use in any market environment.