IQ FX Gann Levels MT5
- 指标
- INTRAQUOTES
- 版本: 1.9
- 更新: 13 五月 2025
- 激活: 5
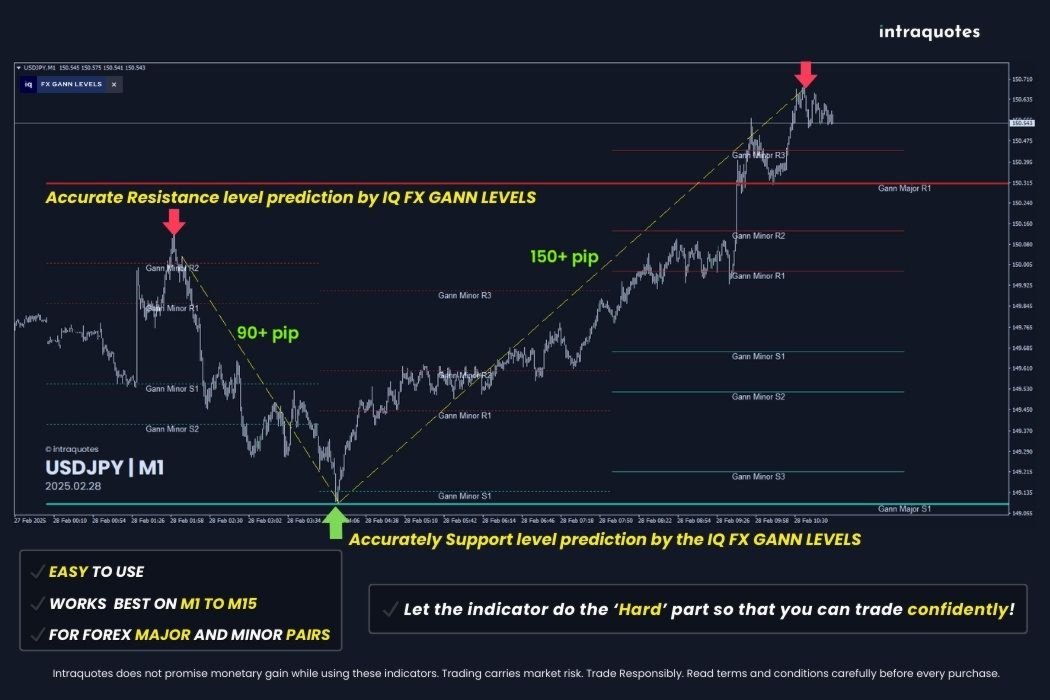
IQ FX Gann Levels a precision trading indicator based on W.D. Gann’s square root methods. It plots real-time, non-repainting support and resistance levels to help traders confidently spot intraday and scalping opportunities with high accuracy. William Delbert Gann (W.D. Gann) was an exceptional market analyst, whose trading technique was based on a complex blend of mathematics, geometry, astrology, and ancient mathematics which proved to be extremely accurate.
- Download the Metatrader 4 Version
- Message us here after purchase to get the Indicator Manual.
- Try Now—Limited Discount for the next 10 Buyers!
Disclaimer:
- Due to regulatory restrictions, our service is unavailable in certain countries such as India, Pakistan, and Bangladesh.
- Our products are available only on mql5.com.
- We never contact anyone or sell our products privately.
- We do not provide any personal trading advice.
- We do not sell any of the Intraquotes products on Telegram or any other platform or website.
A Note from the Developer to all the Traders
Over 15+ years of my journey with WD Gann (William Delbert Gann) Theory, filled with research and countless hours poring over hundreds of resources, I have made a pivotal discovery: a formula within W.D. Gann's works that became the foundation of this IQ FX GANN LEVELS indicator. In recognition of the MQL5 silver award and decades of coding experience, I have put in my best effort to create a highly optimized indicator for all traders. Hope you enjoy it.
Quick Overview
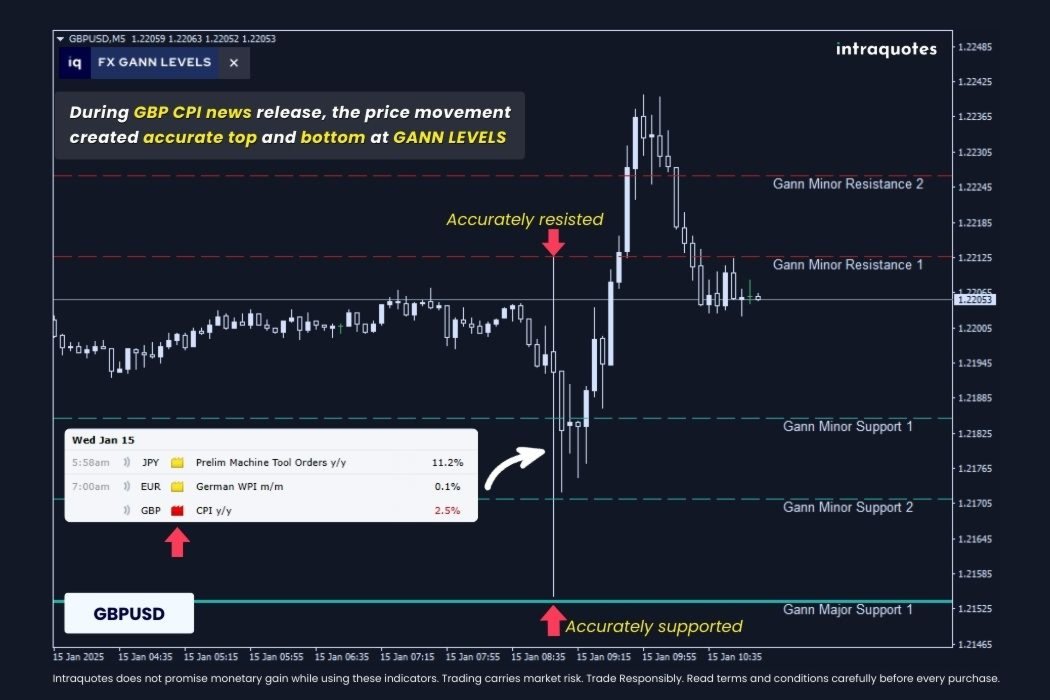
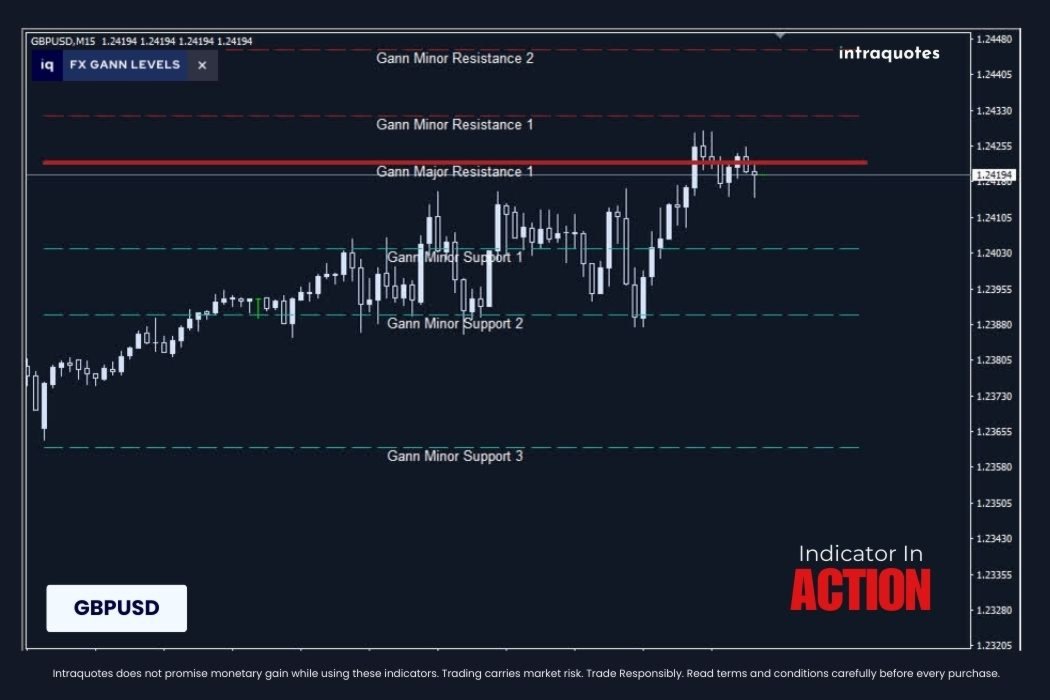
As a trader, foresight is everything. Unlike many Gann indicators out there, this one stands apart—it plots Gann support and resistance levels in advance and never repaints. What you see is what you get—reliable, real-time market insights that you can trust. The accuracy of these levels is exceptional, allowing you to create a well-structured day trading plan, knowing exactly where key market movements are likely to occur. It helps you make well-informed trading decisions with complete confidence.
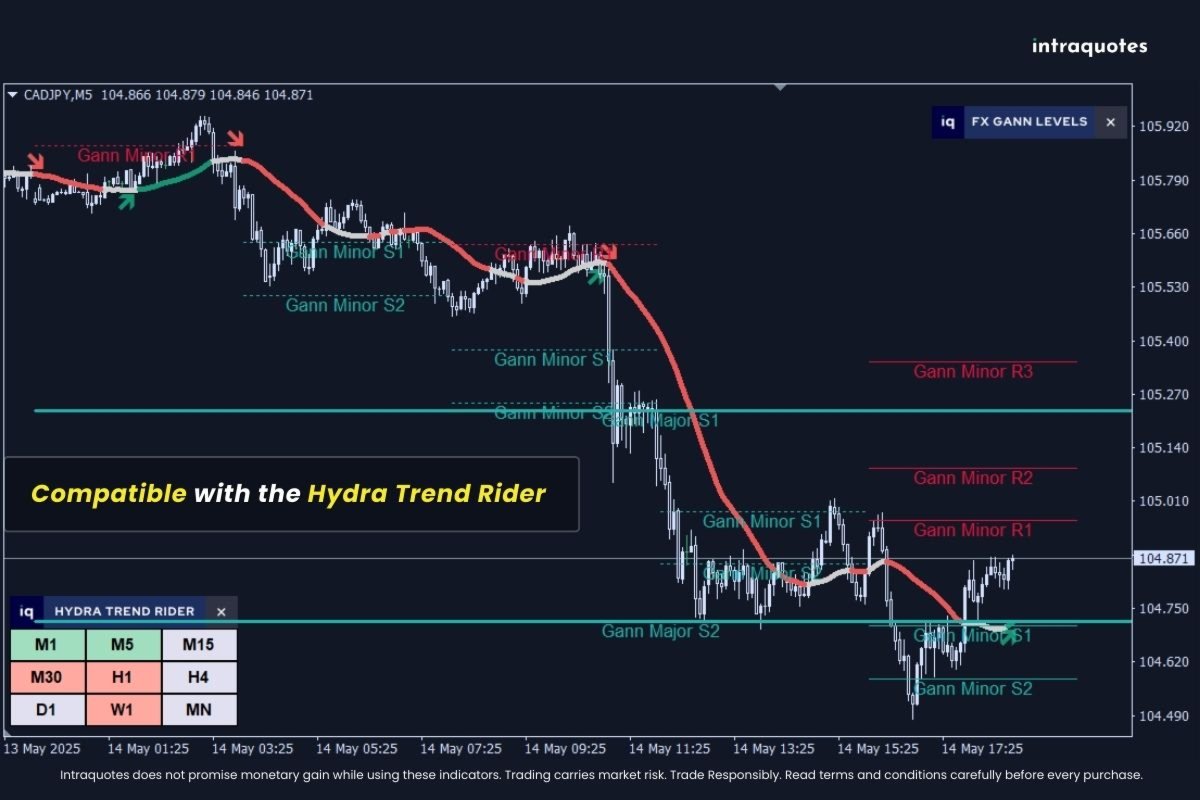
Note: The indicator is Prop firm-ready. Perfect for day trading. This indicator is compatible with the Hydra Trend Rider, and can be used together on the same chart for an optimal trading setup.
1. Why IQ FX GANN Levels Indicator Is Extremely Useful?
-
Suitable for both Scalping & Intraday Trading:
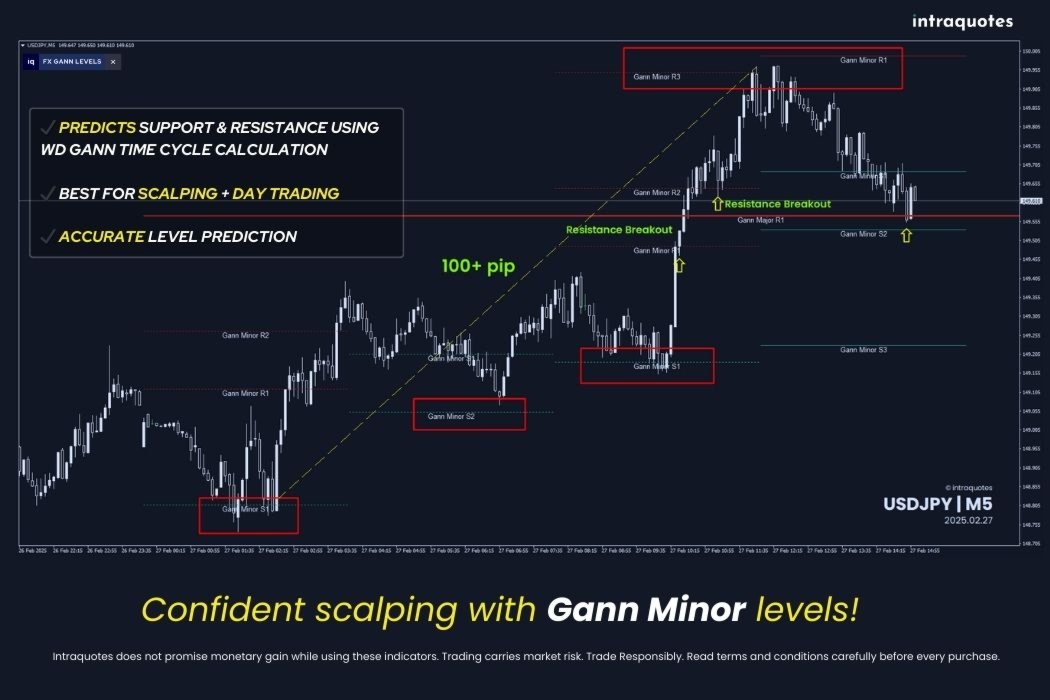
The indicator plots accurate Gann Support & Resistance levels using the Gann square root of nine calculations constantly as the market moves. -
Spot Opportunities Instantly:
Experience more precise live signals for real-time decision-making and sweet point entry exit for profitable trades. -
Cleaner chart with minimalist design:
Accurate support and resistance lines are automatically plotted directly on your chart when you add the indicator to the chart. No complex settings are required to get started. -
Simplified Profit Targets:
The Gann Major and minor support/resistance levels make setting take-profit points easier than ever keeping it flexible for you. The Gann levels update as the market moves creating more room to shift your take profit and trail your stop-loss when the trend continues with the moving market.
2. Learn More at intraquotes MQL5 Channel
If you want to learn more about how this indicator works and how you can take profitable trades, follow our intraquotes official MQL5 channel. We post daily market analysis using this indicator to train our traders how to study the chart with this indicator, where to set targets, and how to take profitable trades. We help you build confidence with daily market analysis using this indicator so that you can trade confidently.
Subscribe to intraquotes MQL5 channel for daily market updates, analysis, and much more.
3. Who is this indicator for?
This Indicator is for intermediate intraday traders, and prop firm traders, who have basic knowledge of price action and technical analysis. Indicators work like a charm for daily trades across different major and minor pairs! IQ FX Gann levels can help you make sweet point entries with low stop loss and high take profit (better R/R ratio).
4. List of Supported Symbols
The indicator has been designed to work with high precision on the following 28th major and minor pairs:-
AUDCAD, AUDCHF, AUDJPY, AUDNZD, AUDUSD.
-
CADCHF, CADJPY, CHFJPY.
-
EURCAD, EURCHF, EURGBP, EURJPY, EURAUD, EURNZD, EURUSD.
-
GBPAUD, GBPCAD, GBPCHF, GBPJPY, GBPNZD, GBPUSD.
-
NZDCAD, NZDCHF, NZDJPY, NZDUSD.
-
USDCAD, USDCHF, USDJPY.
5. Recommended Timeframes:
-
5-minute chart.
6. How to Get Started with IQ FX GANN LEVELS?
-
After purchasing, open MetaTrader Software, login to your account, and open Toolbox - Market - Purchased.
-
Install the indicator.
-
Open Navigator - Market - Drag & drop the indicator to the chart.
-
Follow the Gann levels for confident trading.
7. How do IQ FX Gann Levels Work? (Quick Explanation)
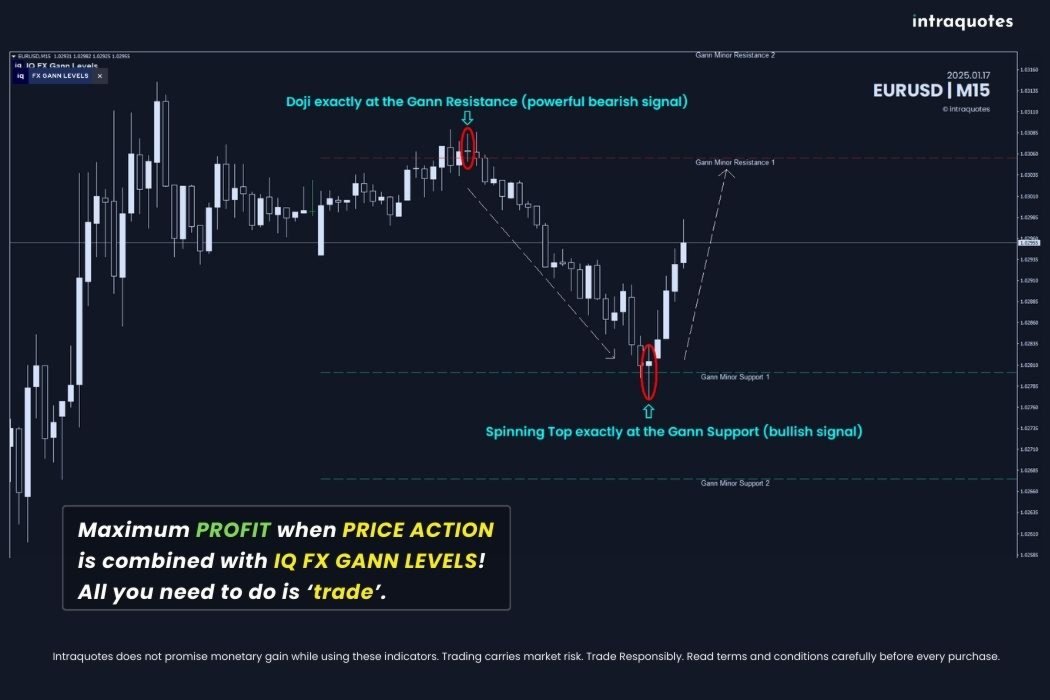
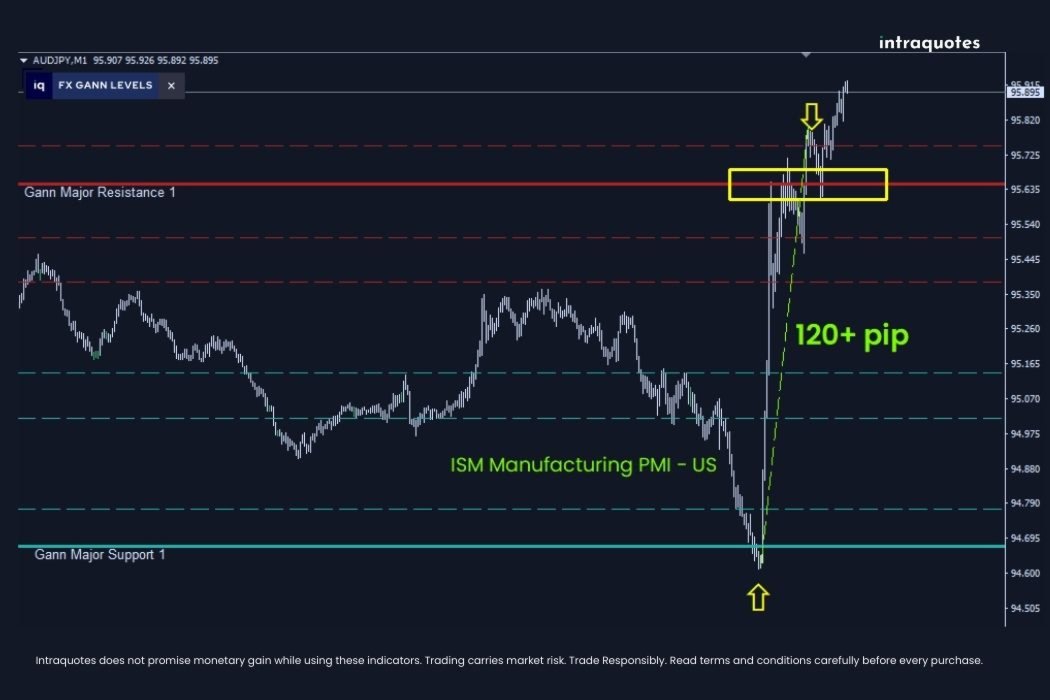
Indicator Plots two types of forecasted Gann Levels
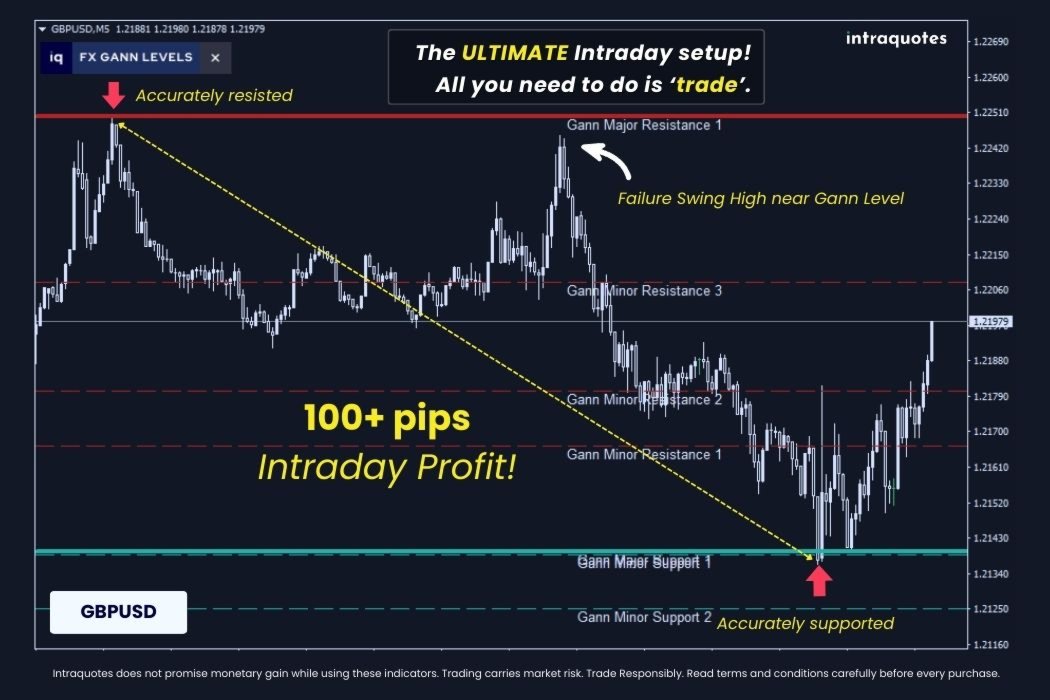
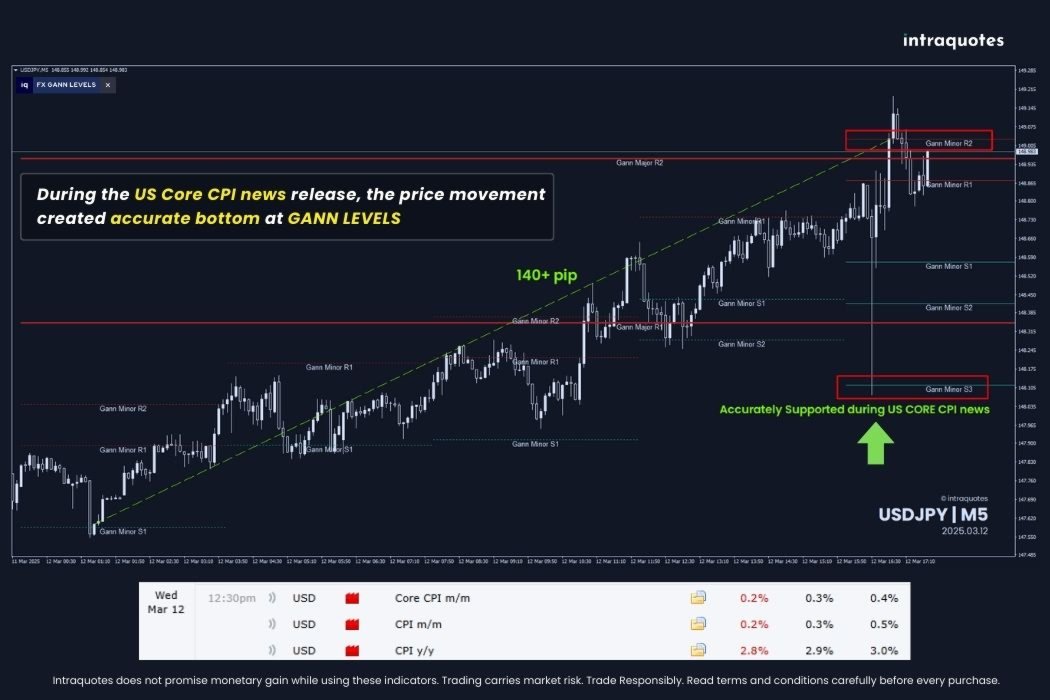
• Major Support/Resistance levels and Minor Support/Resistance Levels where the market reacts accurately. Major levels help in Intraday trading, whereas minor levels help in scalping.
Display Past Gann Levels
• As the market moves with the passing time, the indicator displays past Gann levels of the current day. These past levels help you see exactly where the market reacted proving the Gann levels’ accuracy throughout the day and help you plan your strategy accordingly.
Updating Gann Levels
• The indicator continuously updates all the Gann levels based on complex Gann calculations for precise level plotting.
• This powerful Gann indicator gives you a clear edge by helping you anticipate potential day highs and lows precisely with Gann Support/Resistance Levels with no extra calculation from your side.
8. Compatible Trading Styles
- Trend following
- Breakout
- Continuation
- Trend reversal
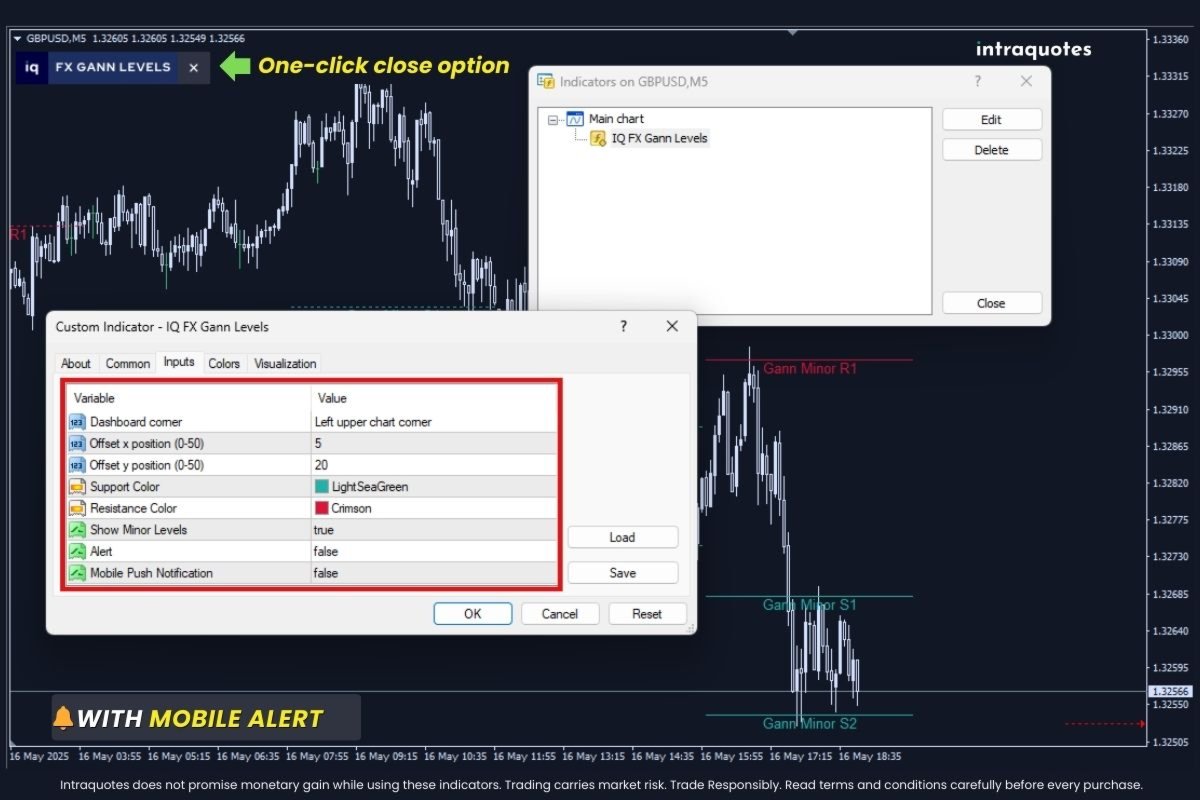
9. Indicator Settings
Customize IQ FX GANN LEVELS as per your preference
-
Option to change Gann Support Levels Color.
-
Option to change Gann Resistance Level Color.
(Custom color option was designed keeping in mind individual trader’s preference for dark theme/light theme background) -
Option to display or hide Gann Minor Levels (True/False).
(Designed keeping in mind Intraday traders' preference) -
Option to Enable/Disable Mobile Alert (True/False).
(Every time the market touches the Major Gann Level, you will be notified if you've enabled the Mobile Alert Option, watch the video for more details).
Note: Indicator does not have buffer output for EA integration.
10. Note for Mobile Alert
To receive mobile alerts for this indicator, enable push notifications in MetaTrader 4 by pressing Ctrl + O (or accessing Options) and navigating to the Notifications tab. Enter your MetaQuotes ID from the MetaTrader app on your mobile device to link it with your platform. Once connected, test the setup to ensure alerts are working. If you face any issues, contact our support team for assistance.
11. FAQ
Q: Does it repaint?
A: Never!
Q: Is there any trial option available?
A: Yes! You can download the demo and backtest.
12. Indicator Troubleshooting
The user guide which you will receive after purchasing the indicator covers all the topics comprehensively. Contact us after you purchase the indicator successfully.
13. Support & Updates:
-
For assistance, send us a direct message on MQL5.
-
Follow our channel for updates and market insights.
-
If you encounter any technical issues with the indicator, contact us directly on MQL5.
Mastering a strategy with this indicator means no second-guessing—just clear intraday levels that set you up for long-term success. Stay disciplined, trade smart, and let the market come to you. Good Luck!
Risk Disclosure:
Trading financial markets carries inherent risks and may not be suitable for every investor. This indicator is designed as a tool to assist in trading decisions but does not guarantee profits or prevent losses, which could exceed your initial investment. Past performance is not a reliable indicator of future outcomes. Users are encouraged to fully understand the risks and seek independent financial advice if needed. Any trading decisions made using this indicator are at the user's discretion and responsibility.
Related topic: WD Gann, trend, trade levels, support, resistance, market movement, intraday levels, intraday trading, scalping, hedging, etc.