Cap Channel Trading Indicator MT5
Download Cap Channel Trading Indicator for MetaTrader 5
The Cap Channel Trading Indicator leverages the Triangular Moving Average (TMA) to help traders identify ranging market conditions and potential trend reversals. This indicator comprises three lines: the middle line, which represents the TMA, and two additional lines positioned at a fixed distance above and below the TMA.
«Indicator Installation & User Guide»
MT5 Indicator Installation | Cap Channel Trading Indicator MT4 | ALL Products By TradingFinderLab | Best MT5 Indicator: Refined Order Block Indicator for MT5 | Best MT5 Utility: Trade Assistant Expert TF MT5 | TP & SL Tool: Risk Reward Ratio Calculator RRR MT5 | Money Management: Easy Trade Manager MT5 | Trade Copier: Free Fast Local Trade Copier MT5
Cap Channel Trading Indicator Specifications Table
Here’s a polished table that describes the specifications of the Cap Channel Trading Indicator:
| Category | Volatility - Bands and Channels – Currency Strength |
| Platform | MetaTrader 5 |
| Skill Level | Intermediate |
| Indicator Type | Range - Breakout |
| Timeframe | Multi-Timeframe |
| Trading Style | Day Trading |
| Market | All Markets |
Indicator Overview
In the Cap Channel Trading Indicator, identifying bullish or bearish trends is achievable through breakouts above or below the channel lines.
- Buy Signals: Triggered when the price breaks above the upper channel line, indicating potential upward momentum and a possible trend reversal driven by liquidity accumulation.
- Sell Signals: Issued when the price breaks below the lower channel line, signaling potential downward momentum and a likely trend reversal due to liquidity accumulation.
This functionality allows traders to align their strategies with emerging trends effectively.
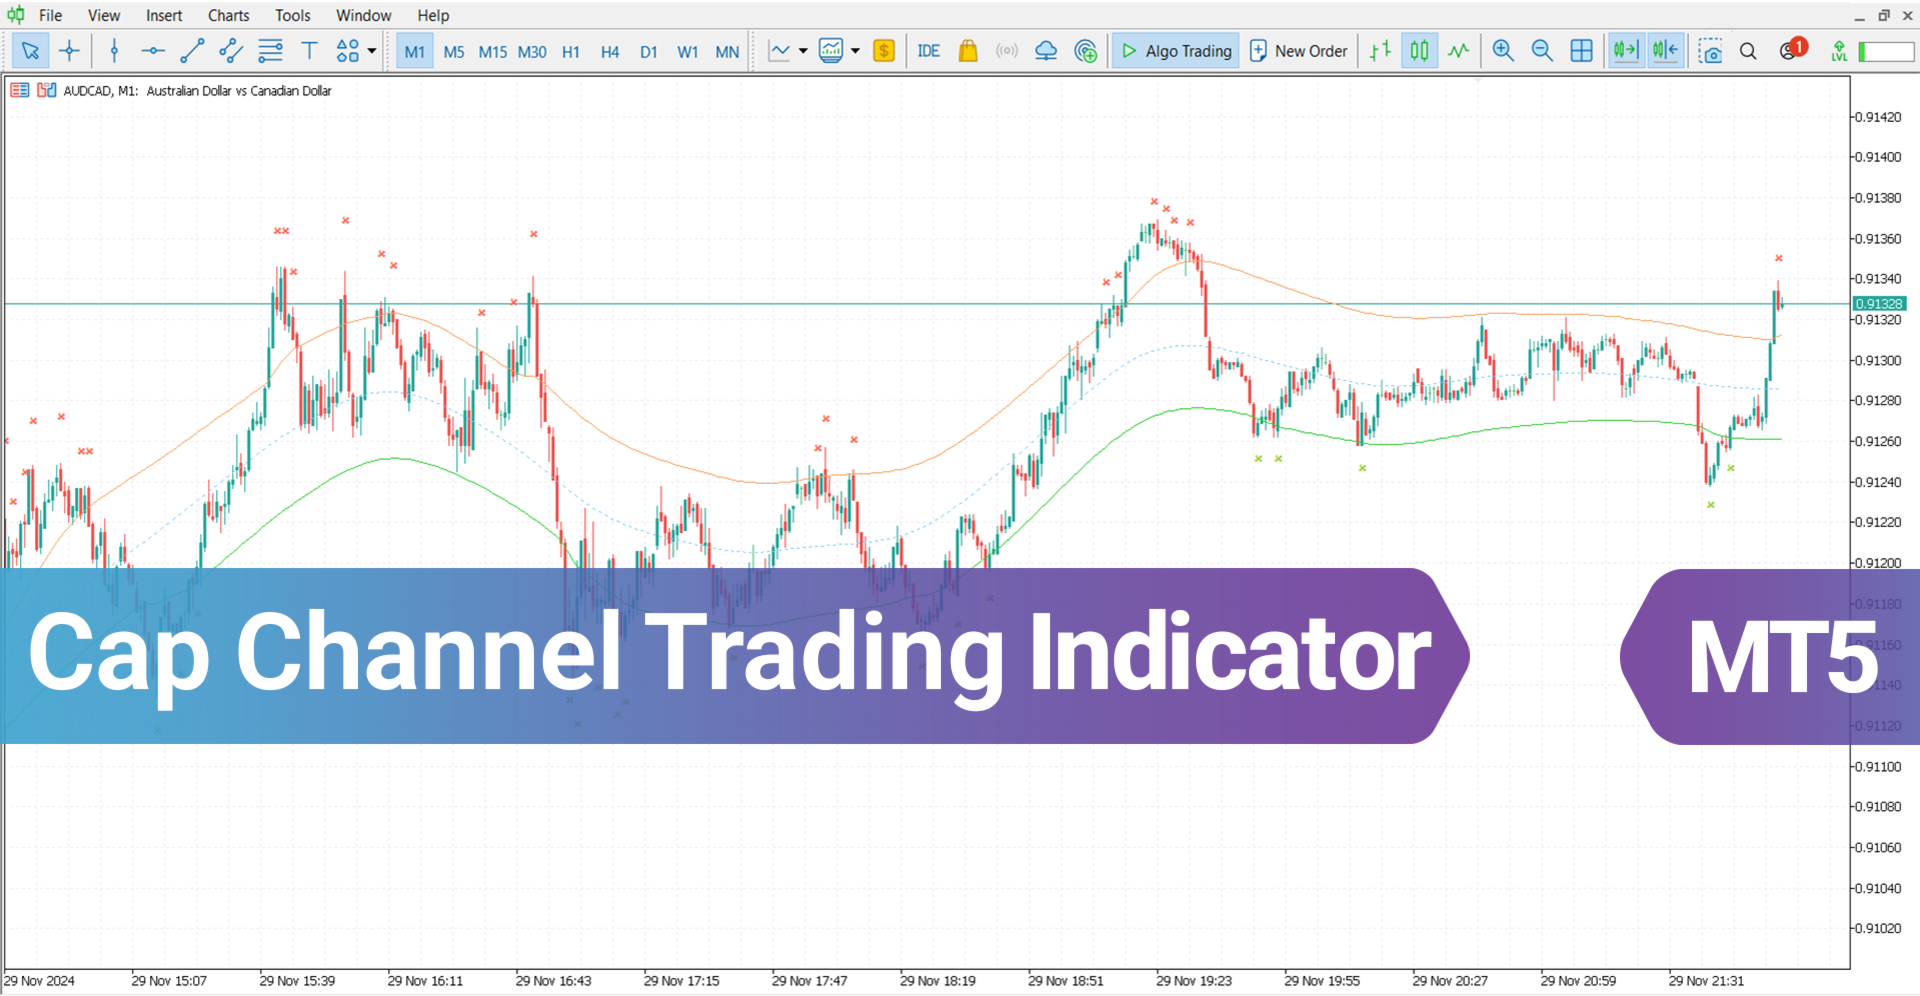
Uptrend Conditions
On the 1-minute price chart of the US Dollar to Swiss Franc (USD/CHF) currency pair, the price breaks below the green line (representing the lower channel) and subsequently accumulates liquidity. This accumulation confirms a trend reversal, leading to the issuance of a Buy signal.
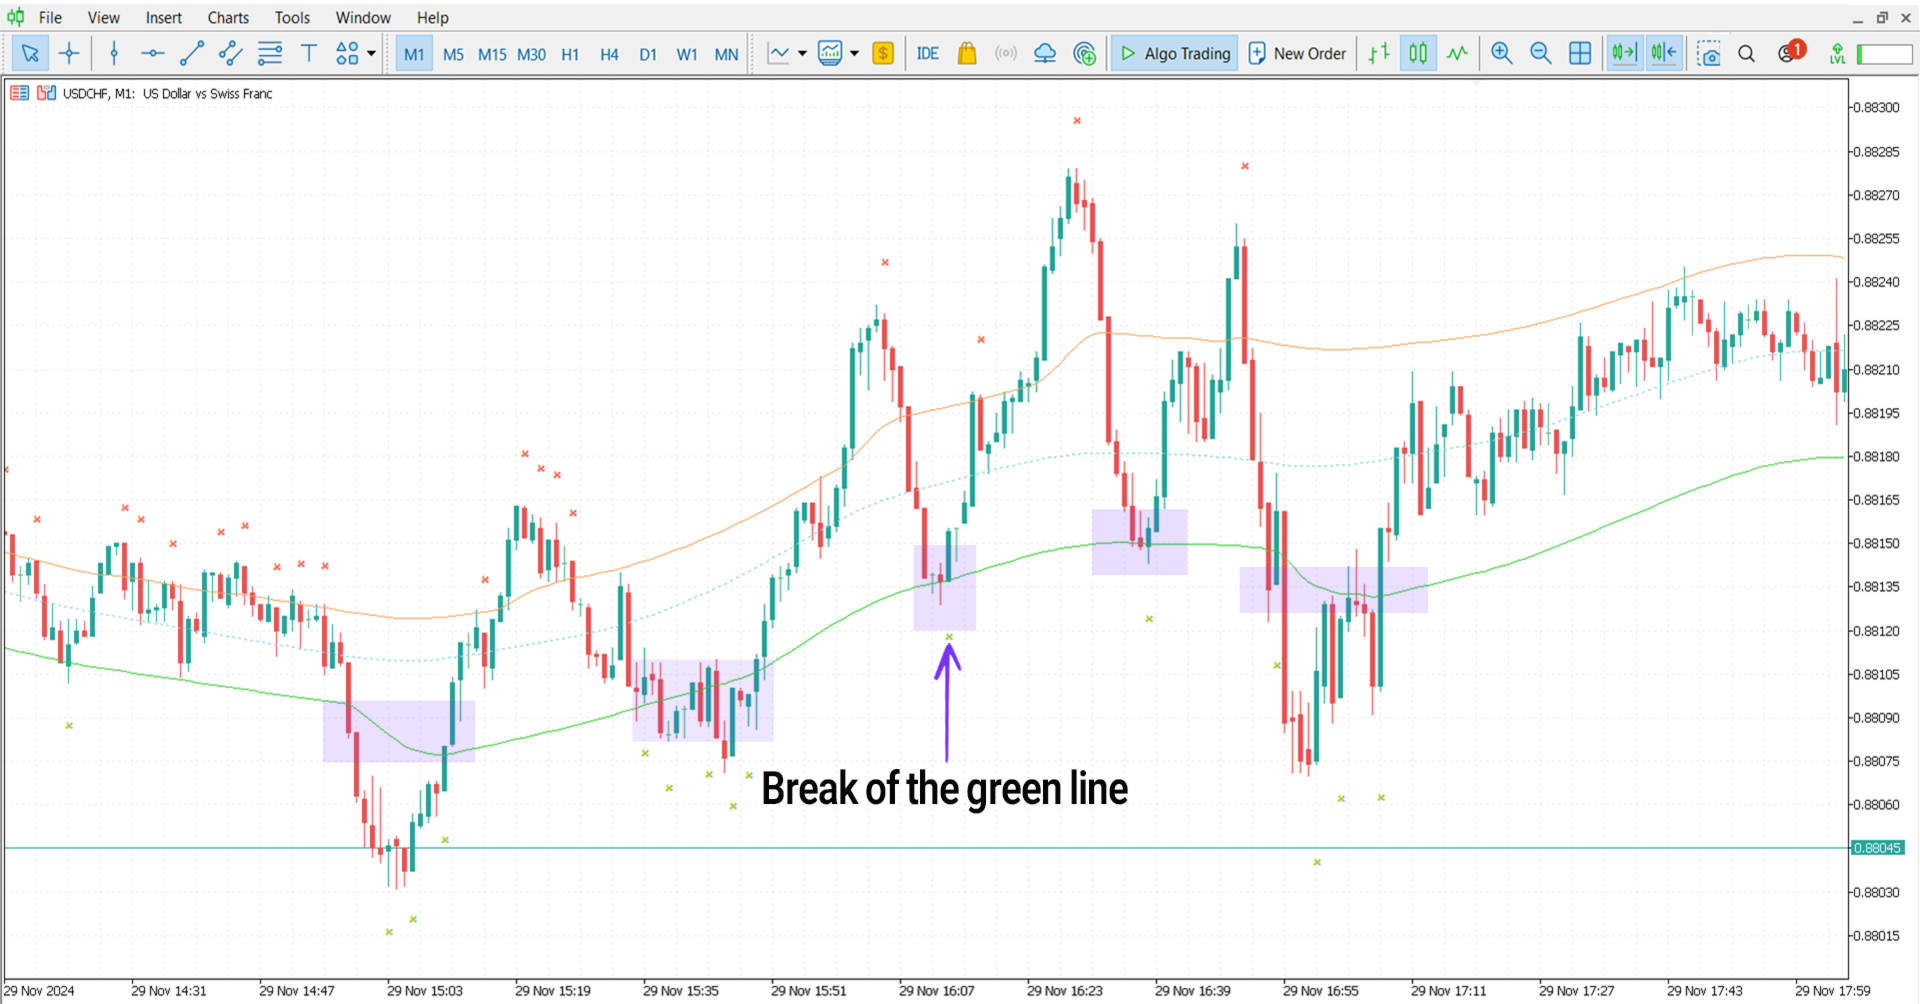
Downtrend Conditions
The following chart illustrates the global gold price (XAU/USD) on the 1-minute timeframe. When the price breaks above the red line (representing the upper channel), liquidity accumulates, signaling a trend reversal and triggering a Sell signal.
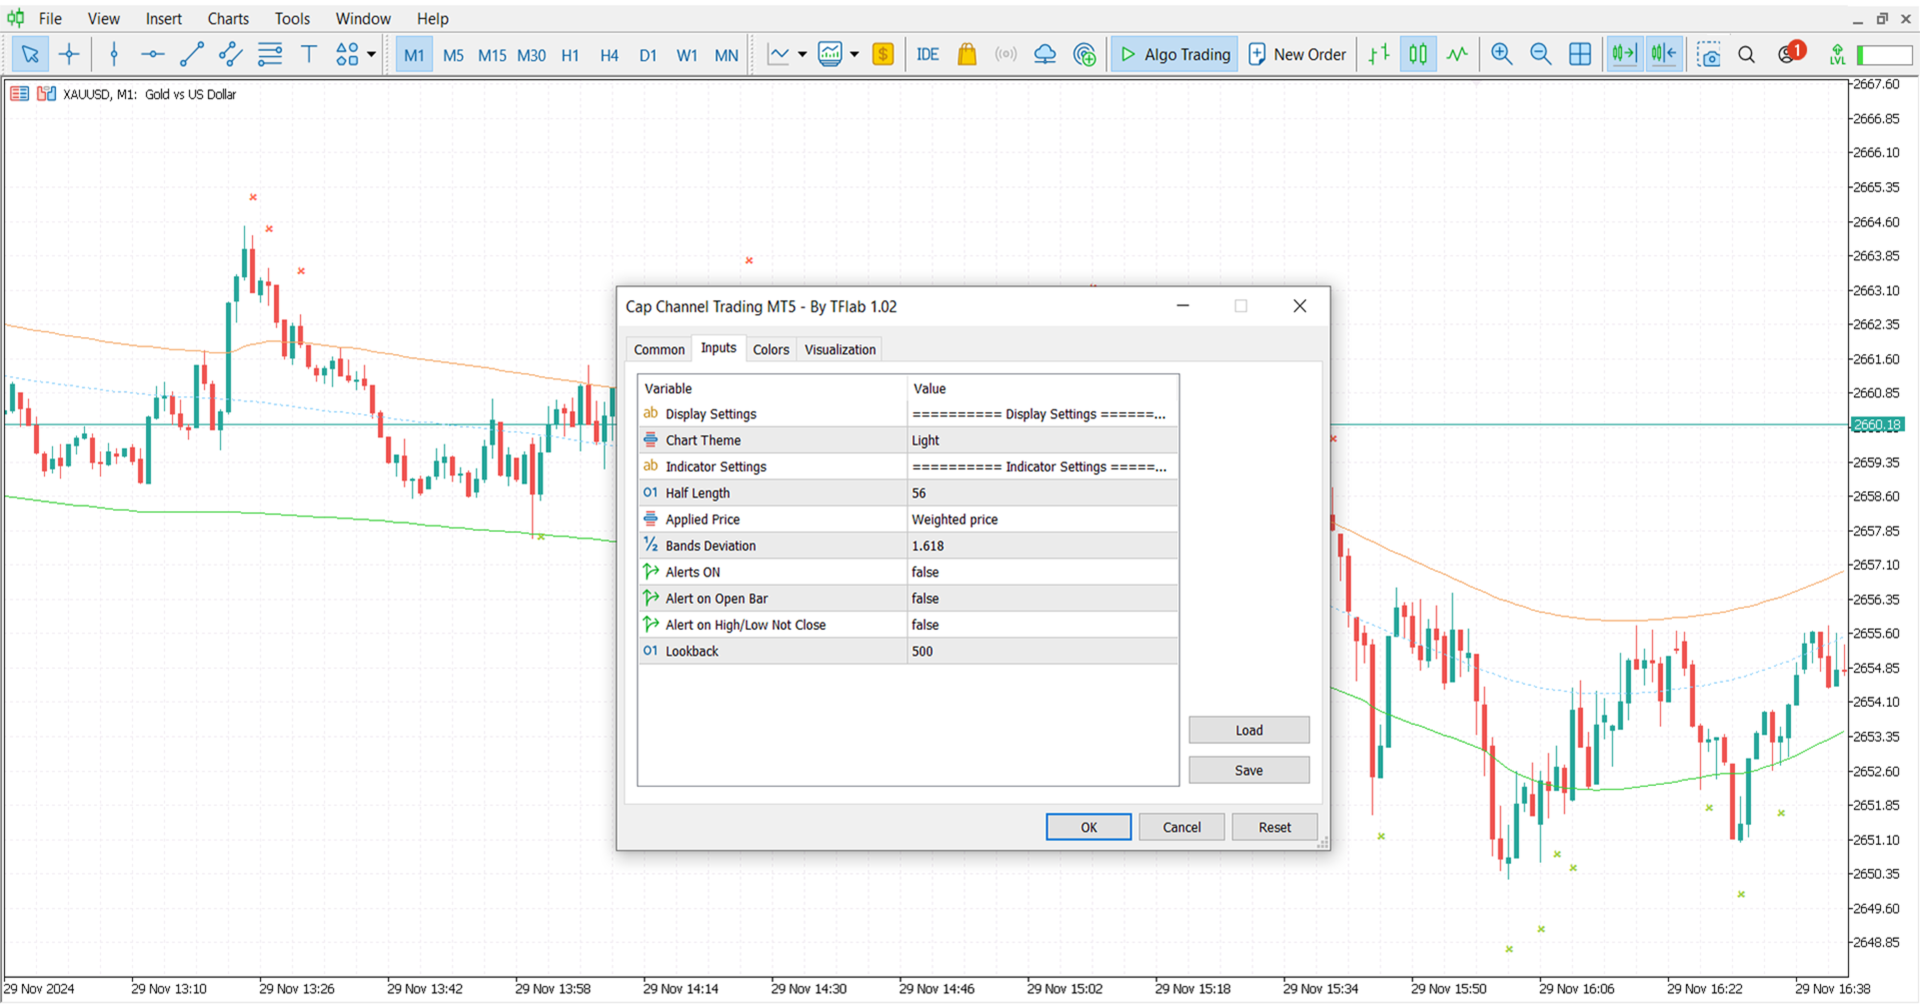
Indicator Settings
The settings displayed in the image outline the adjustable parameters of the Cap Channel Trading Indicator, allowing traders to customize its behavior based on their preferences and market conditions
Display settings
- Chart-theme: Chart theme.
Indicator settings
- Half-length: Half distance;
- Applied price: Applied price;
- Bands deviation: Band deviation;
- Alert on: Alert on;
- Alert on current: Alert on current;
- Alert on high low: Alert for high and low;
- Lookback: Lookback.
Conclusion
The Cap Channel Trading Indicator is a highly effective tool for identifying support and resistance levels, forecasting breakouts, and determining entry and exit points for traders.
Functioning as a price channel, it consists of three key components: the upper line, lower line, and middle line. Each line offers critical insights into the price movement range, helping traders make informed decisions in the market.


Спасибо