PAFX Secret Indicator MT4
PAFX Secret Indicator for MetaTrader 4
The PAFX Secret Indicator for MetaTrader 4 is crafted to assist traders in spotting divergence patterns and underlying market direction shifts. It blends insights from six major oscillators—MOMENTUM, CCI, RSI, Stochastics, MACD, and Awesome Oscillator—to enhance the precision of divergence detection across various chart setups.
«Indicator Installation & User Guide»
MT4 Indicator Installation | PAFX Secret Indicator MT5 | ALL Products By TradingFinderLab | Best MT4 Indicator: Refined Order Block Indicator for MT4 | Best MT4 Utility: Trade Assistant Expert TF MT4 | TP & SL Tool: Risk Reward Ratio Calculator RRR MT4 | Money Management: Easy Trade Manager MT4 | Trade Copier: Free Fast Local Trade Copier MT4
Indicator Table
| Category | Tools – Oscillator – Price Action |
| Platform | MetaTrader 4 |
| Skill Level | Intermediate |
| Indicator Type | Reversal – Trend-Following |
| Timeframe | Multi-Timeframe |
| Trading Style | Intraday Trading |
| Trading Market | Forex – Cryptocurrency – Stocks |
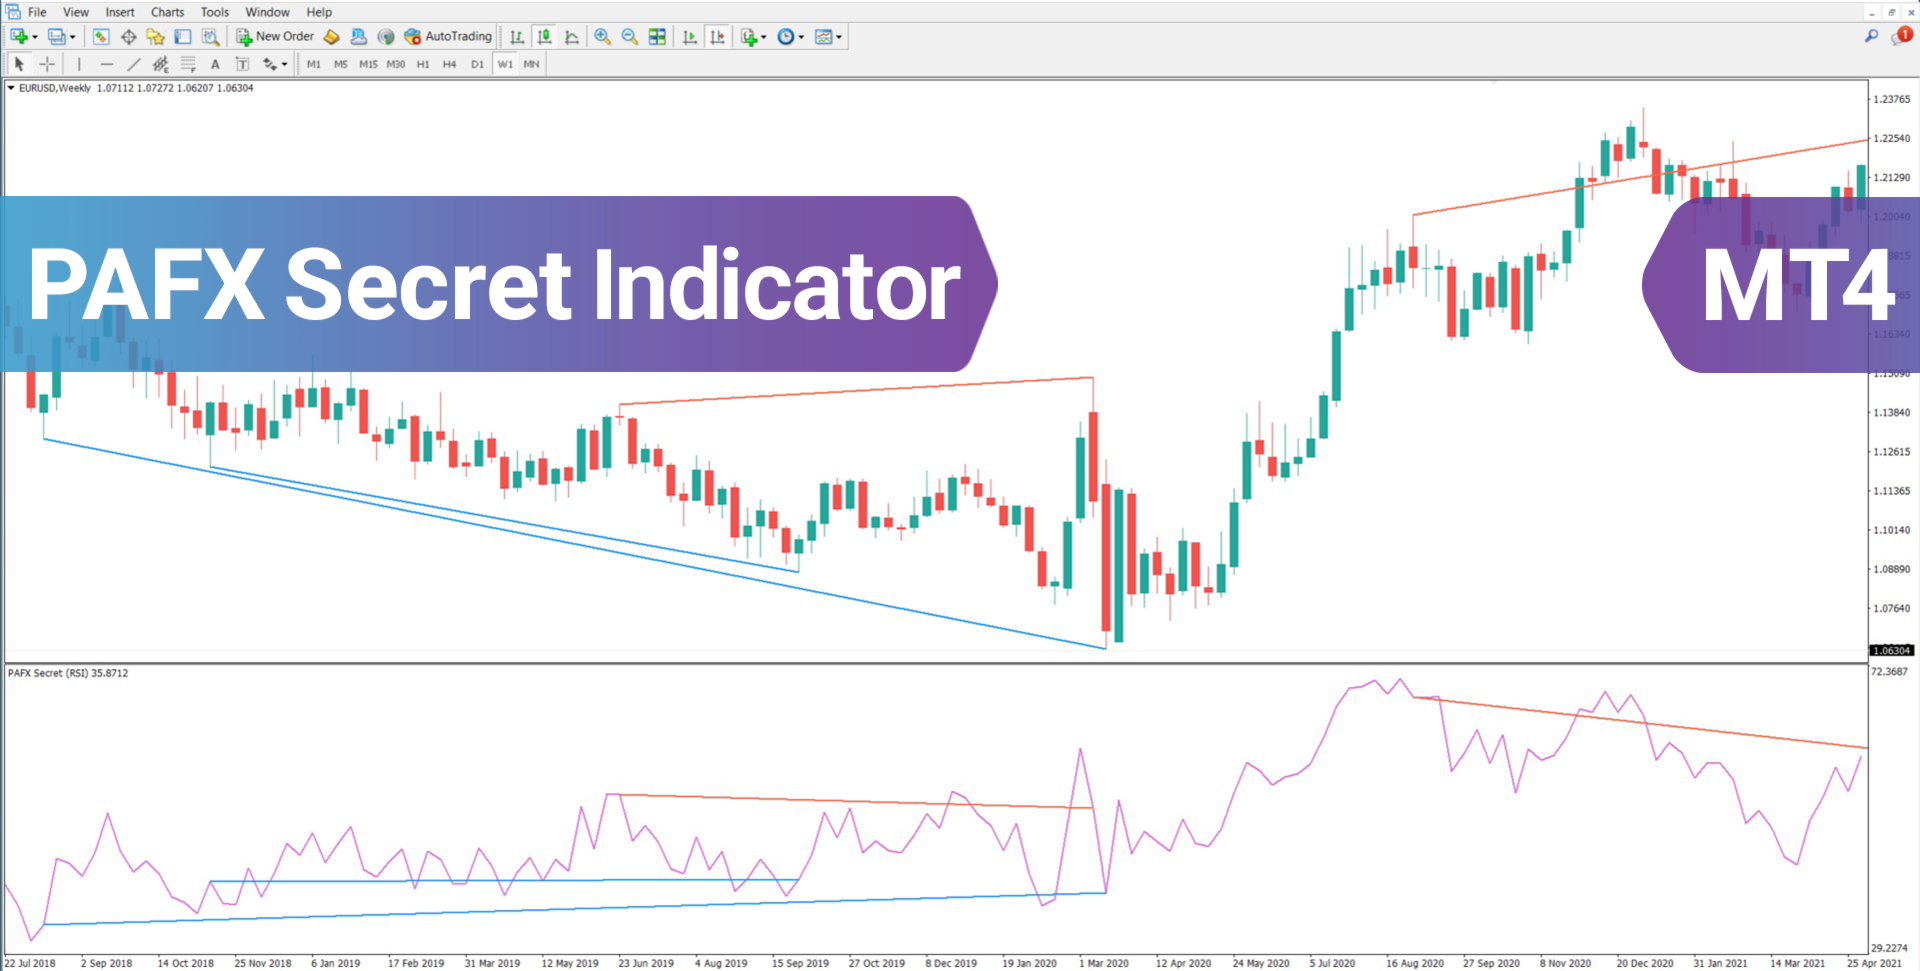
Overview of the Indicator
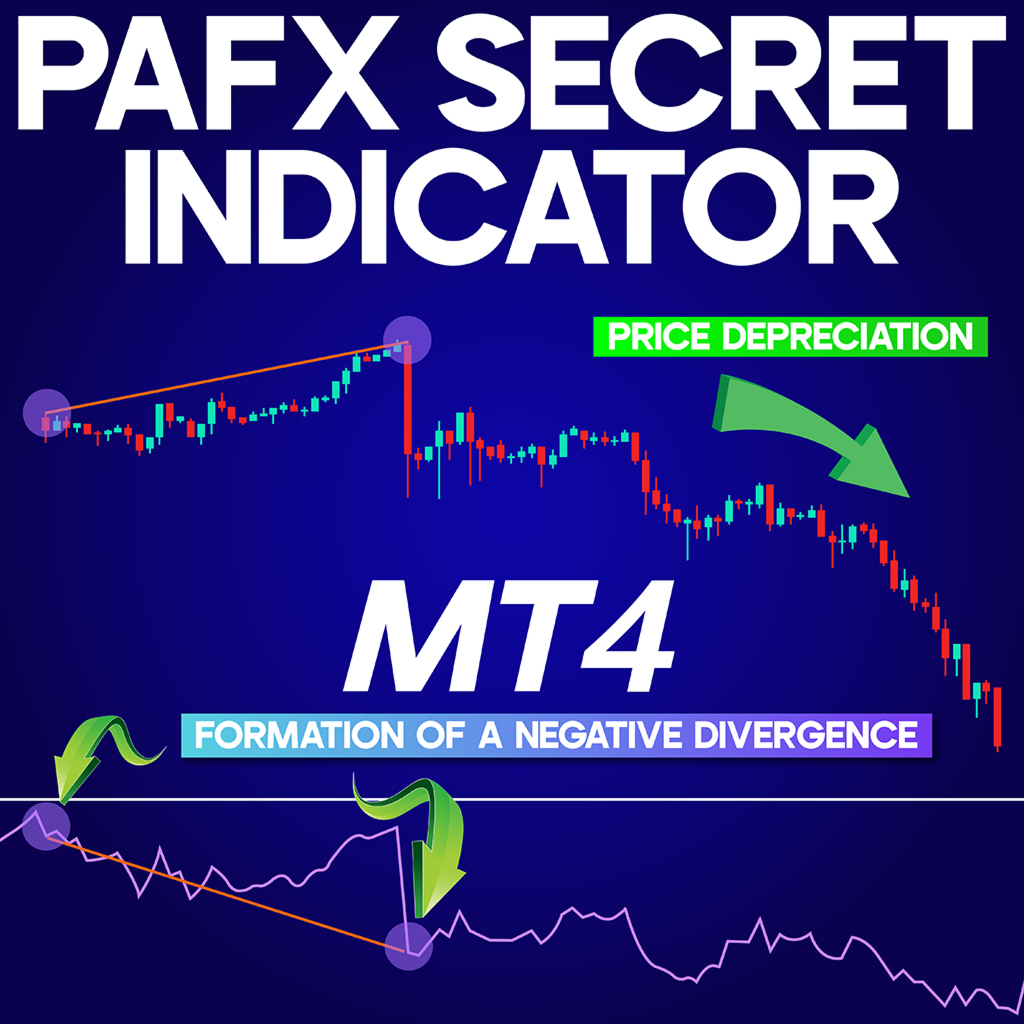
Divergence in trading is the disconnect between price action and oscillator movement—where one rises while the other declines. This often precedes a change in trend direction and signals traders to anticipate a shift. Within the PAFX Secret Indicator, these divergences are highlighted through a color-coded system: red signifies a bullish divergence (potential upward shift), while blue indicates a bearish divergence (possible downward move), allowing for quick recognition and decision-making.
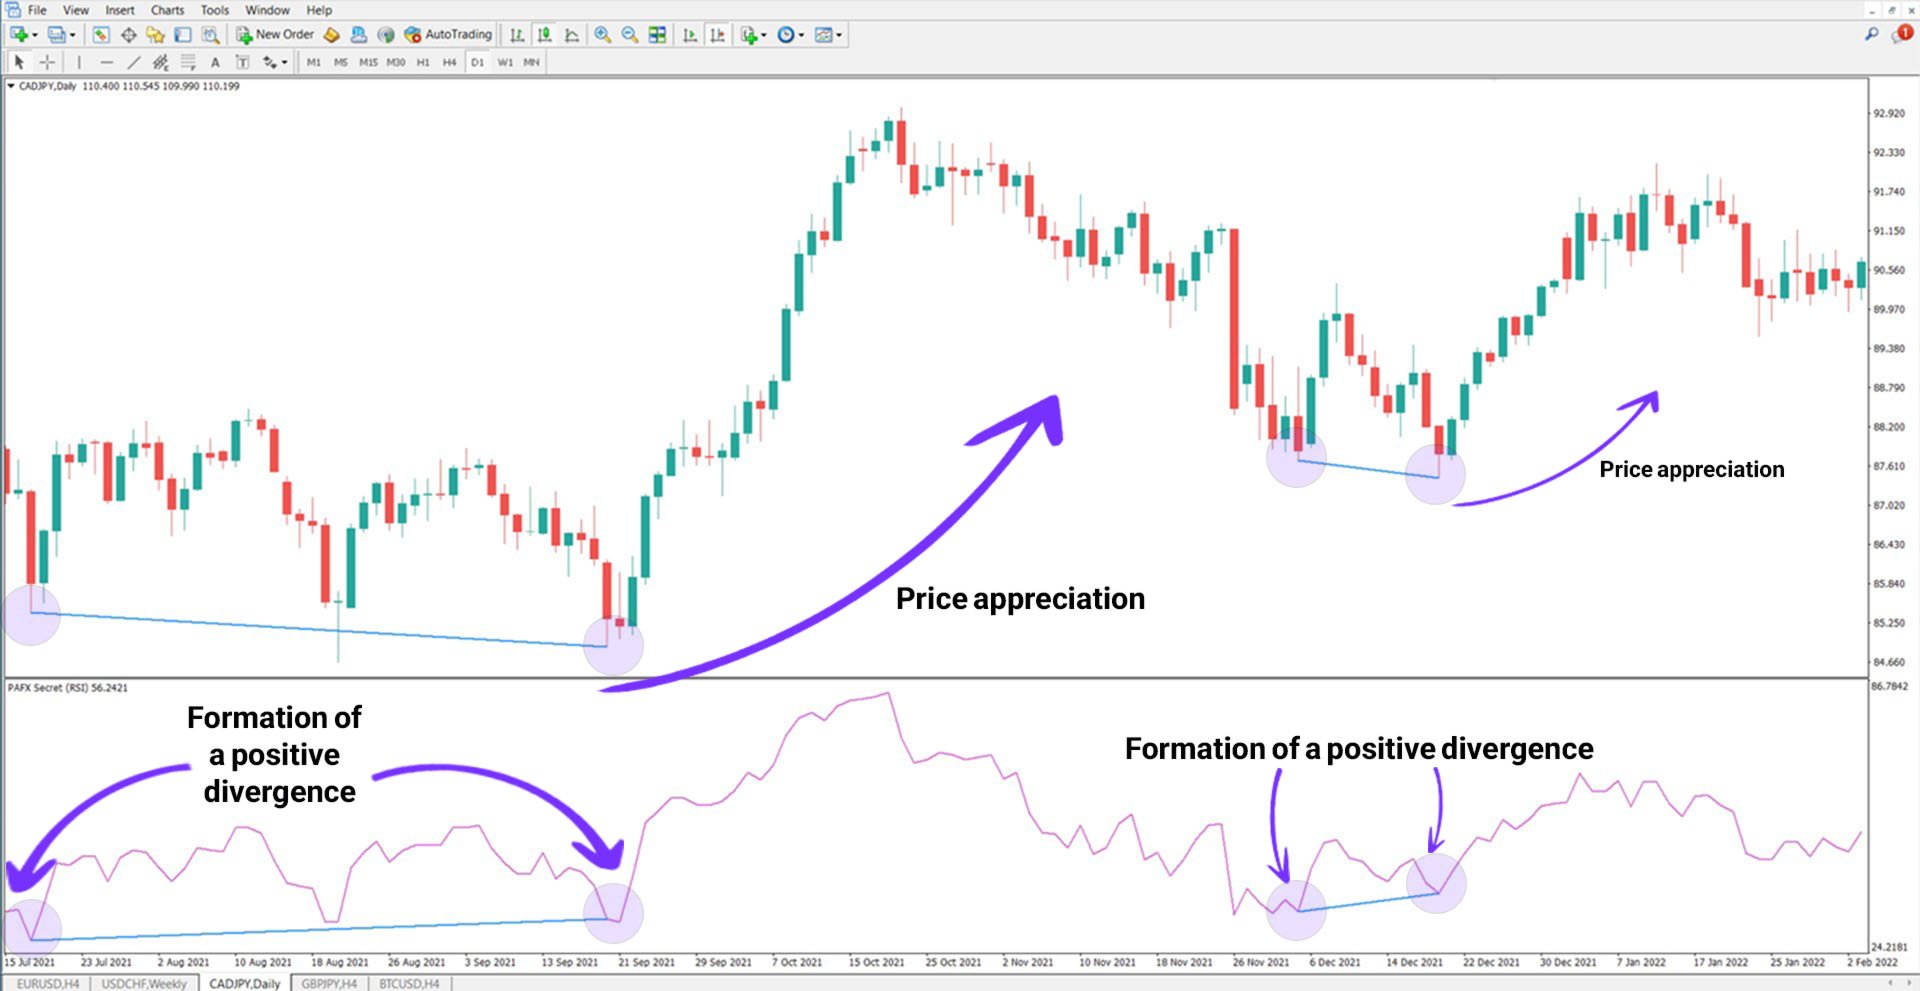
Bullish Divergence in Action
Consider the daily chart of CAD/JPY: two bullish divergences appear. Here, although price reaches a lower low, the oscillator indicates a higher low—suggesting that bearish momentum is fading. Traders analyzing this can look for long opportunities once their system provides confirmation.
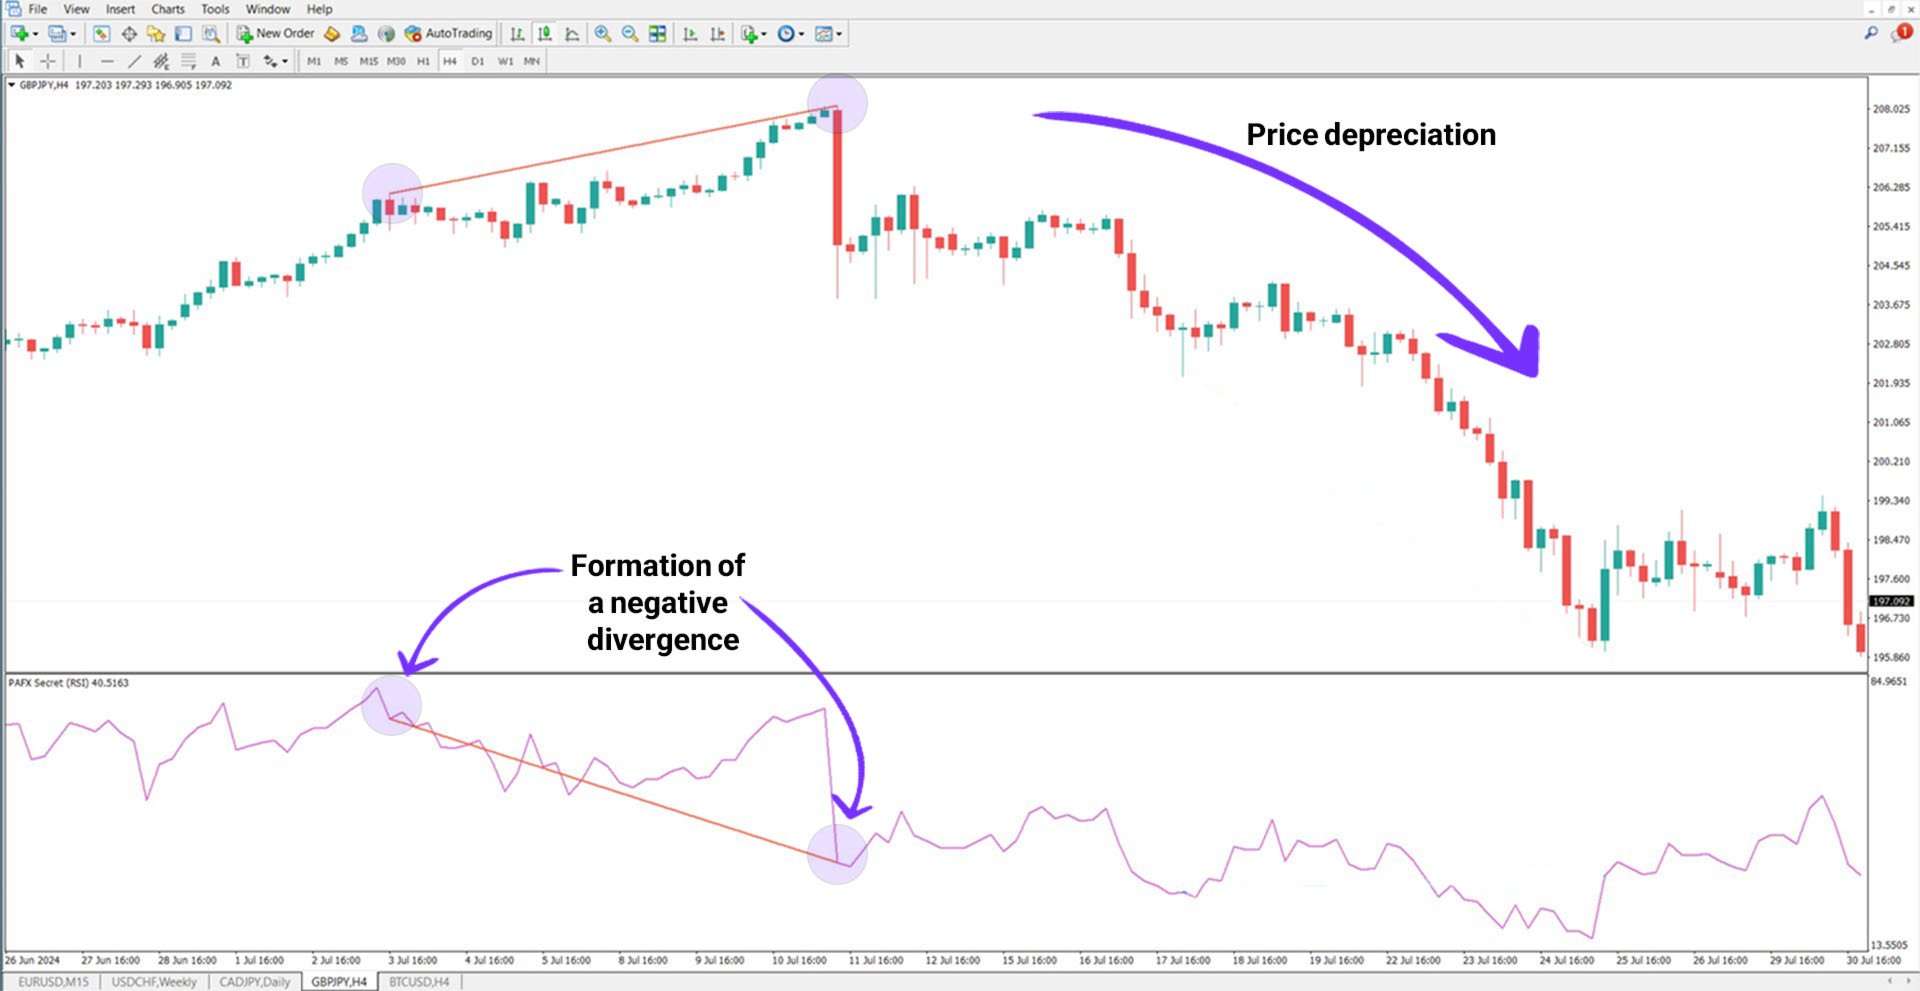
Bearish Divergence in Action
On the GBP/JPY 4-hour chart, a bearish divergence takes shape. Price attempts to reach a new high but fails, forming a lower high, while the oscillator forms a higher high. This mismatch can indicate a weakening uptrend and may lead traders to prepare for short setups based on further confirmations.
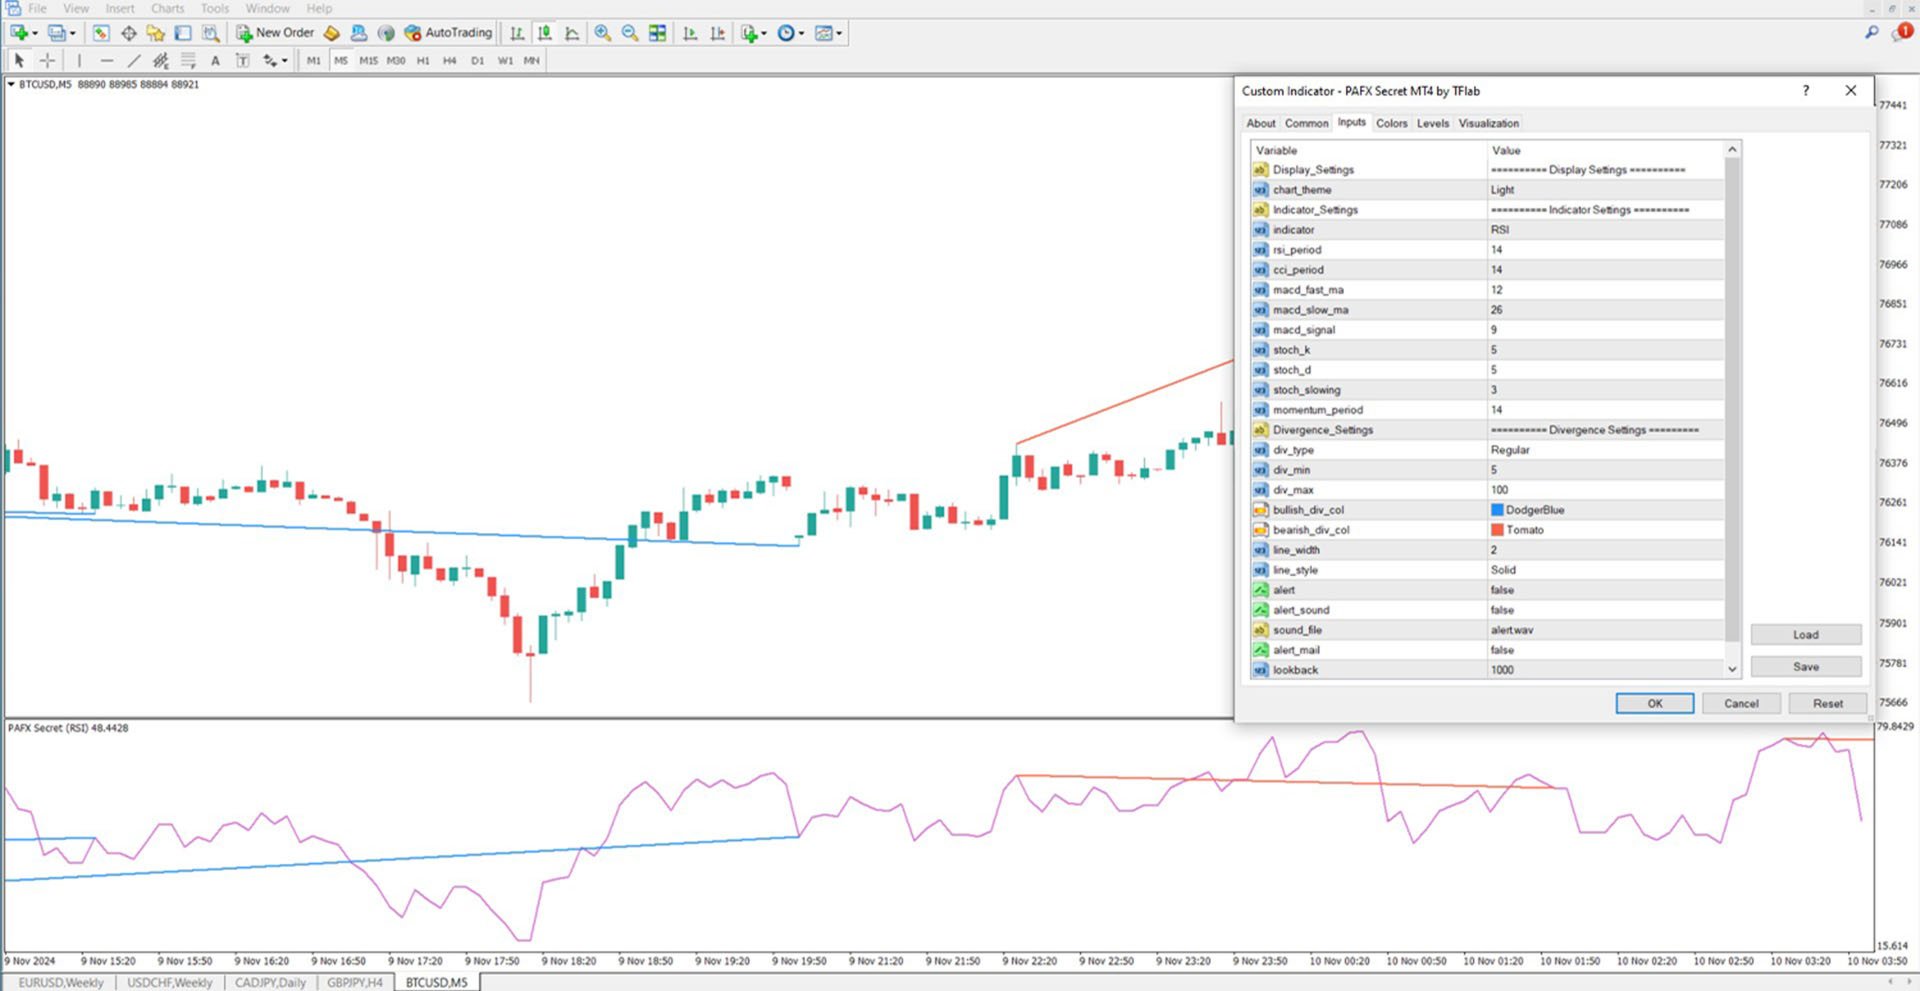
Indicator Configuration Options
- Chart Theme: Defines background display (light/dark);
- Oscillator Selection: Choose from CCI, RSI, MACD, MOMENTUM, etc. (default: RSI);
- RSI Period: Timeframe for RSI calculation (default: 14);
- CCI Period: Number of bars for CCI analysis (default: 14);
- MACD Settings:
- Fast MA (default: 12)
- Slow MA (default: 26)
- Signal (default: 9)
- Stochastic Parameters:
- %K (default: 5)
- %D (default: 5)
- Slowing (default: 3)
- Momentum Period: Set to 14 by default;
- Divergence Type: Regular, hidden, or both (default: Regular);
- Minimum/Maximum Candle Range: Define search window for divergence (default: 5–100);
- Line Width & Style: Customize how divergence lines are rendered;
- Alert System:
- Audio alerts
- On-screen notifications
- Email alerts for new divergence signals;
- Lookback Period: Sets the candle range used in internal calculations.
Conclusion
Divergence signals are a powerful element of chart analysis, offering early warnings of potential market reversals.
When price action contradicts oscillator movement, it can reveal momentum shifts not visible on price charts alone. The PAFX Secret Indicator for MetaTrader 4 simplifies the detection of these signals, helping traders spot trend exhaustion and prepare for possible entries or exits in crypto, forex, or stock markets.