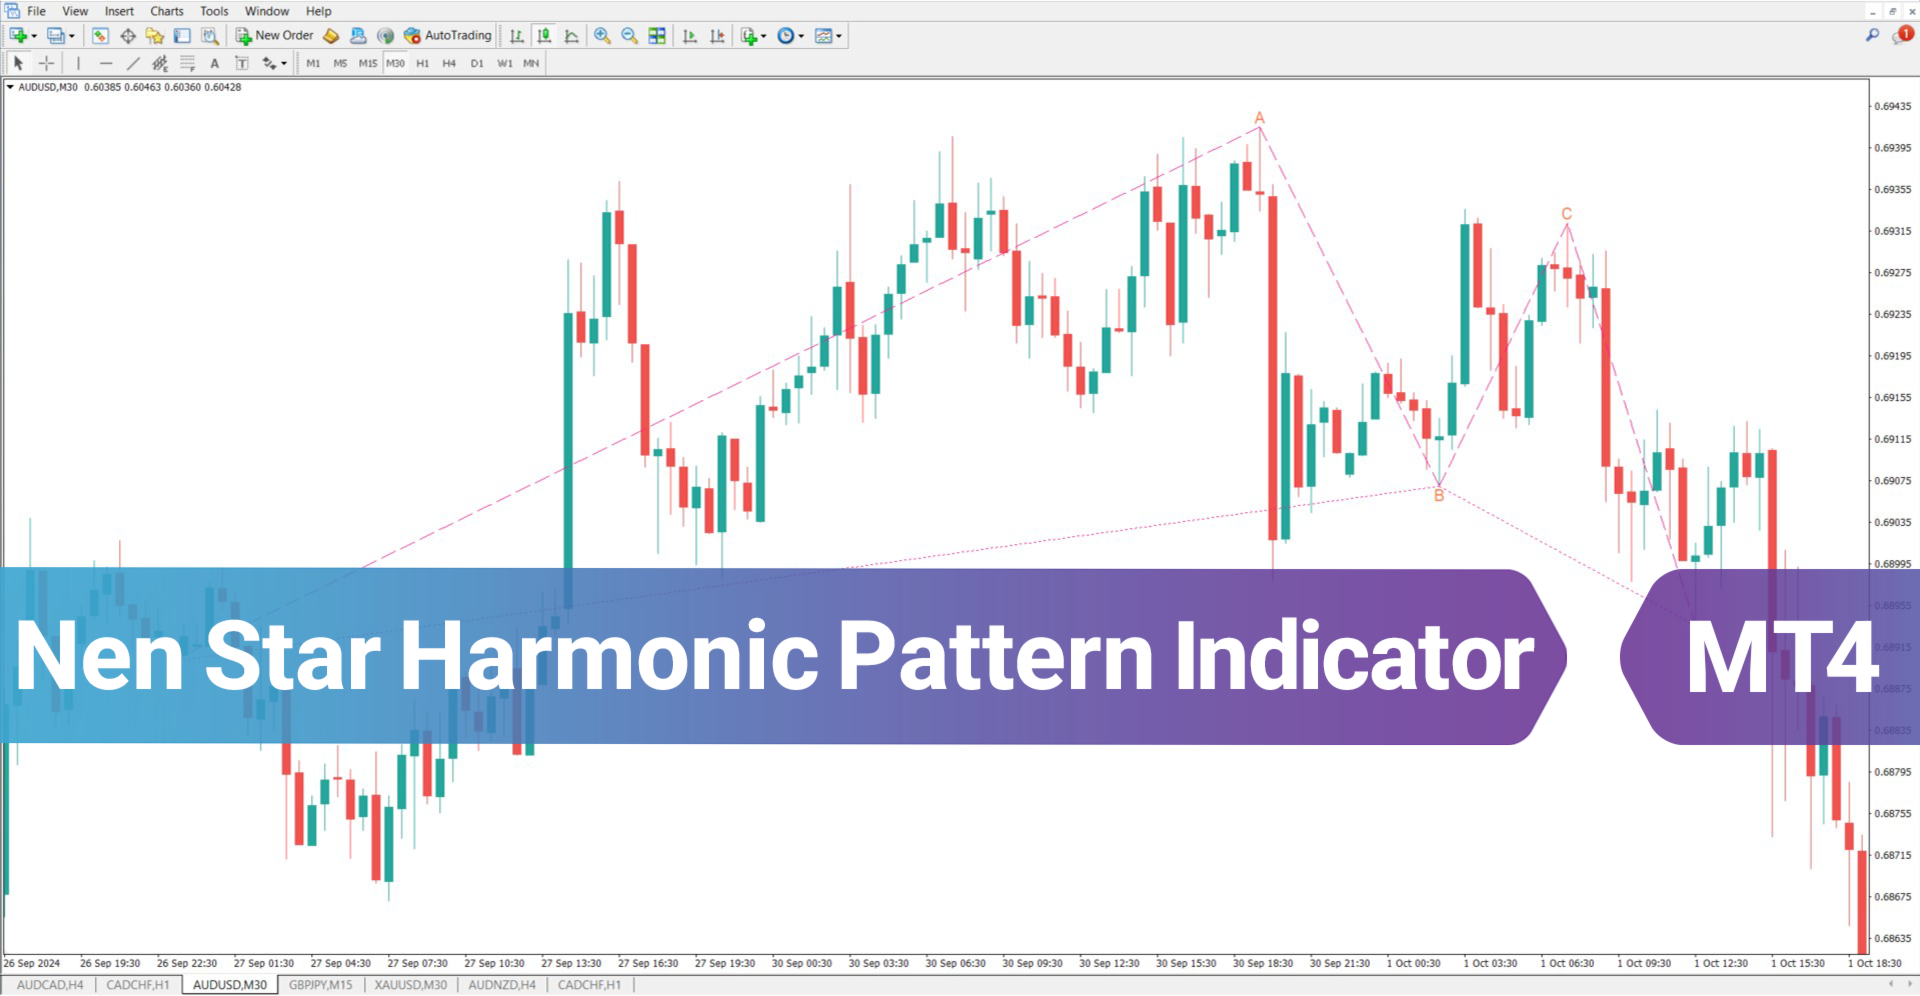
Nen Star Harmonic Pattern Indicator MT4
Nen Star Harmonic Pattern Indicator for MetaTrader 4
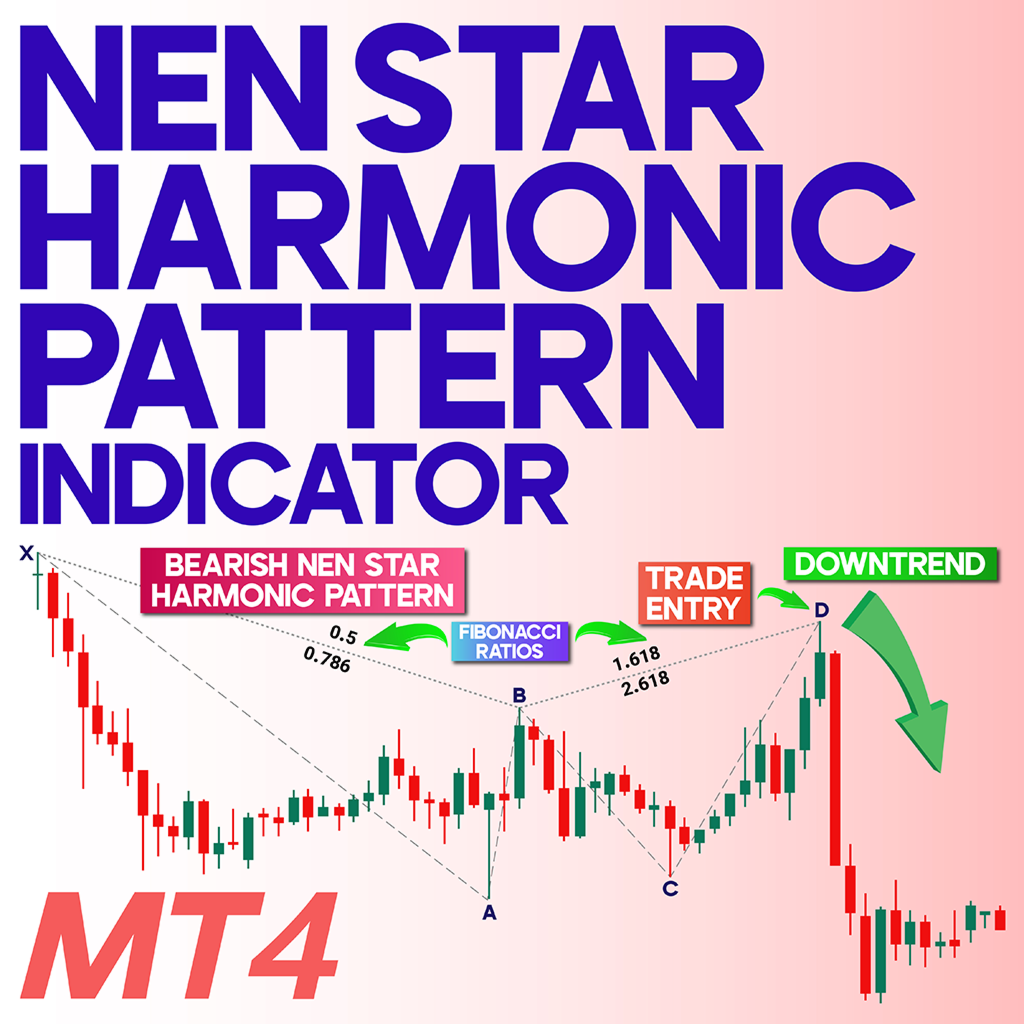
The Nen Star Harmonic Pattern Indicator is an advanced tool in technical analysis that relies on Fibonacci ratios to identify potential price reversal zones. This pattern is used by traders to spot precise turning points in the market.
The structure consists of five key points: X, A, B, C, and D, and can appear in both bullish and bearish trends. In bullish formations, it resembles the letter "M", while in bearish setups, the pattern forms a "W"-shaped structure.
«Indicator Installation & User Guide»
MT4 Indicator Installation | Nen Star Harmonic Pattern Indicator MT5 | ALL Products By TradingFinderLab | Best MT4 Indicator: Refined Order Block Indicator for MT4 | Best MT4 Utility: Trade Assistant Expert TF MT4 | TP & SL Tool: Risk Reward Ratio Calculator RRR MT4 | Money Management: Easy Trade Manager MT4 | Trade Copier: Free Fast Local Trade Copier MT4 | Money management + prop protector: Trade Assist Prop Protector MT4
Nen Star Harmonic Pattern Indicator Specifications Table
The following table outlines the main features of the Nen Star Harmonic Pattern Indicator:
| Category | Harmonic Pattern – Support and Resistance – Classic & Chart Patterns |
| Platform | MetaTrader 4 |
| Skill Level | Intermediate |
| Indicator Type | Continuation – Reversal |
| Timeframe | Multi-timeframe |
| Trading Style | Intraday Trading |
| Trading Market | All Markets |
Indicator Overview
In the Nen Star pattern, the movement begins at point X and continues to point A, followed by a retracement to point B. Then, price extends toward point C, which typically measures 113% to 141.4% of the AB leg. The final move is to point D, which usually falls between 127.2% and 200% of the AB leg.
Point D acts as the Potential Reversal Zone (PRZ), where traders often find key entry or exit opportunities depending on the price action.
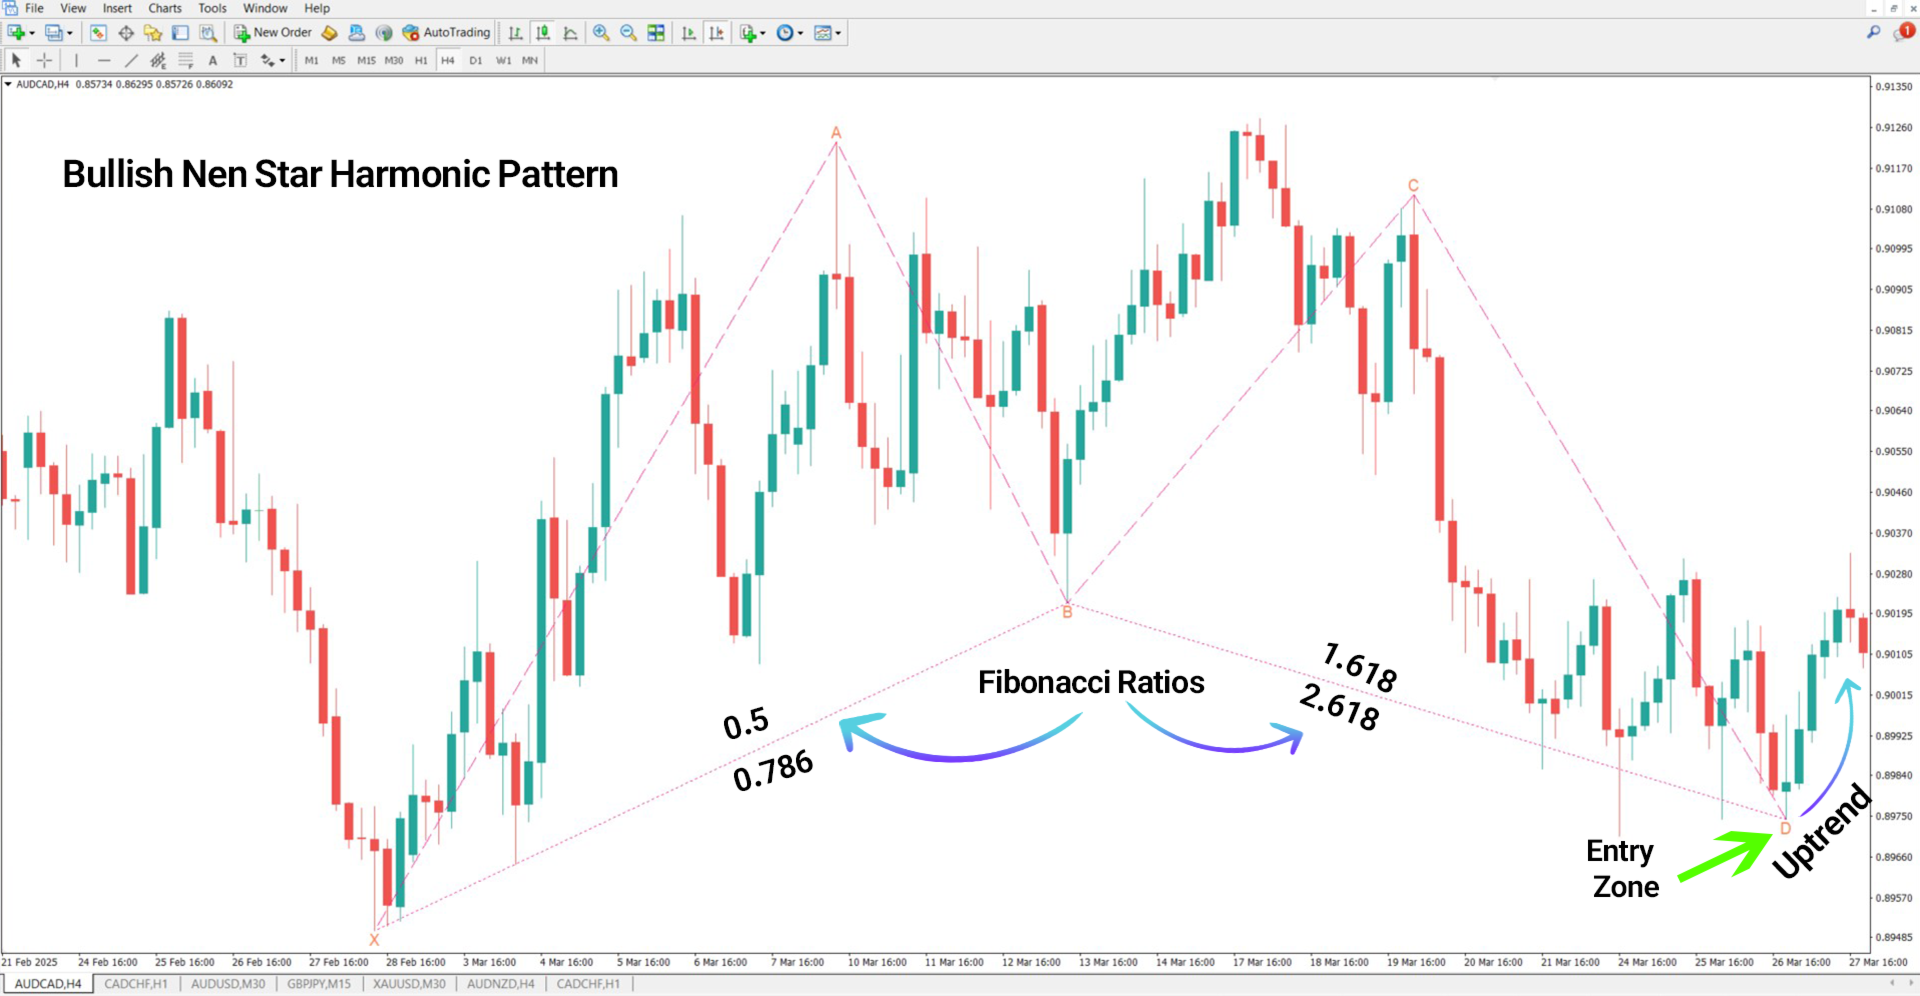
Indicator in Bullish Trend
In a bullish setup of the Nen Star pattern, price moves from X to A, retraces to B, and expands through C, reaching 113%–141.4% of the AB leg. The price then continues to D, typically positioned between 127.2%–200% of the AB leg. On the 4-hour AUD/CAD chart, the price enters the PRZ at point D, showing signs of a trend reversal and the emergence of a bullish move.
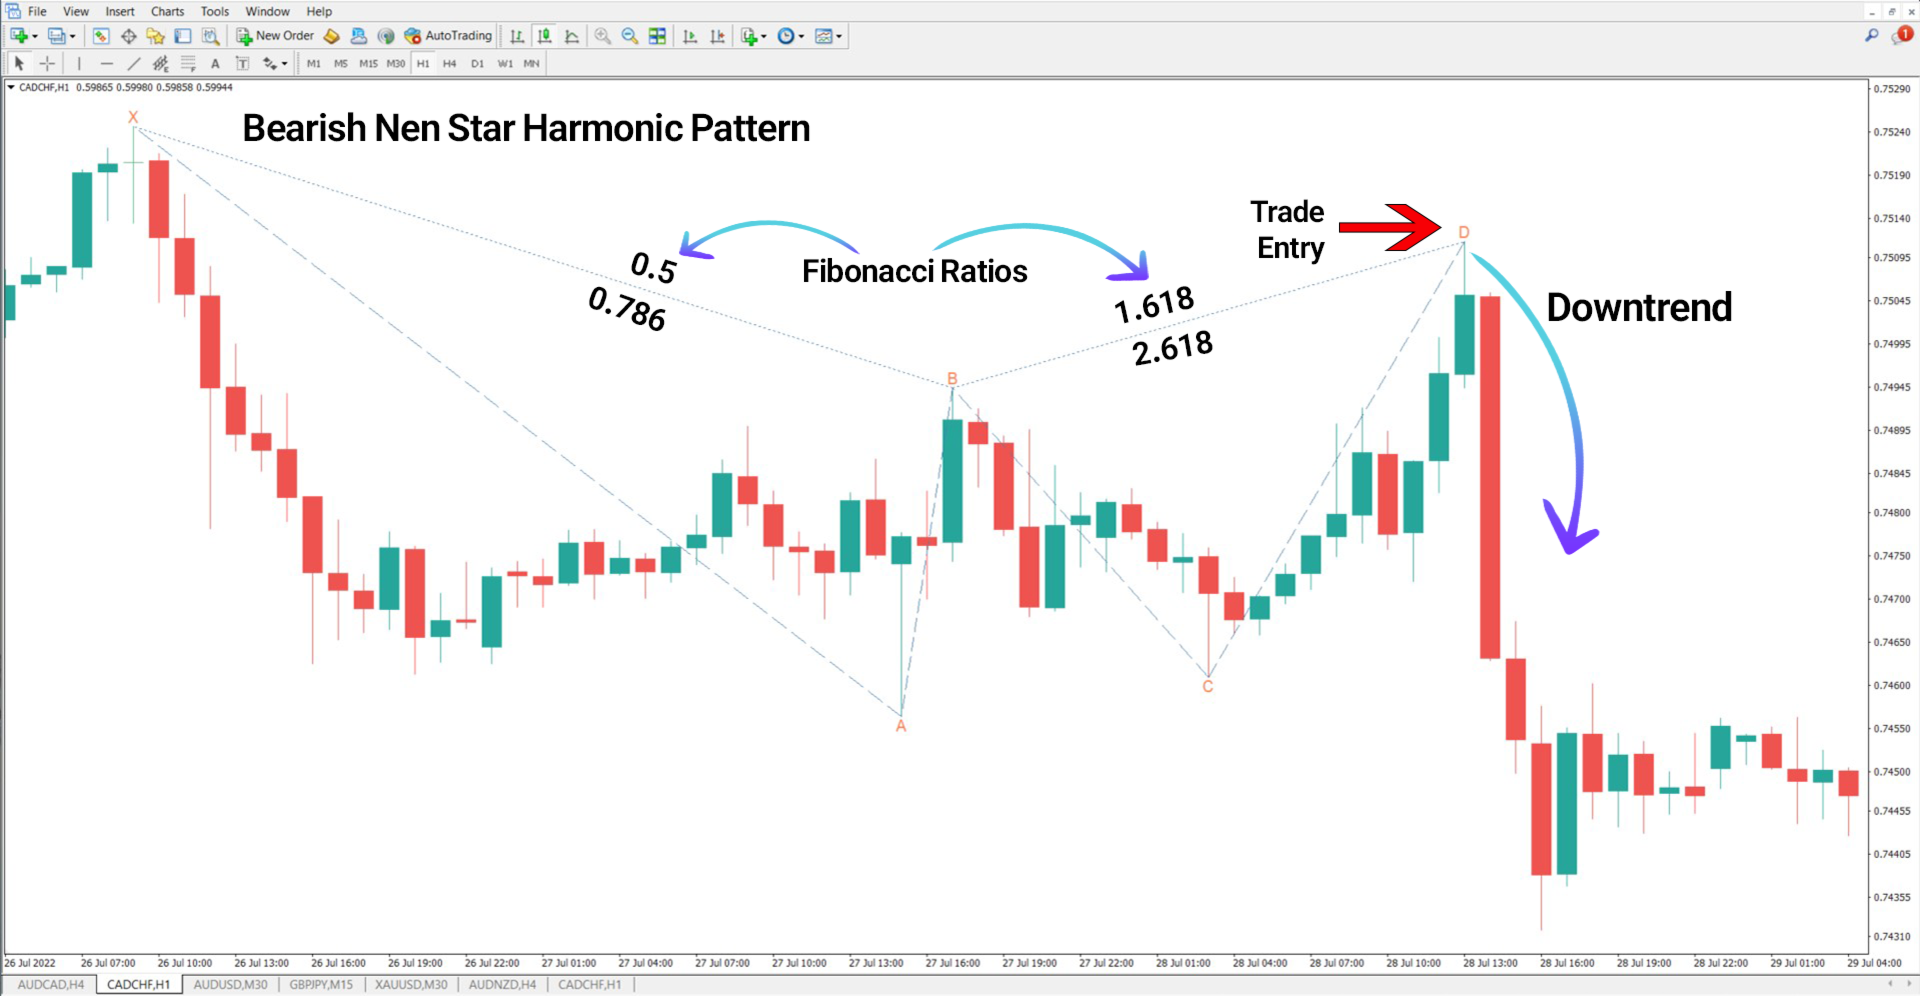
Indicator in Bearish Trend
In the 1-hour CAD/CHF chart, a bearish Nen Star pattern develops as price moves from X to A, retraces to B, and temporarily rises to C, extending 113%–141.4% of AB. The price then falls to D, located between 127.2% and 200% of AB. This setup resembles the letter "W", with D acting as the primary Potential Reversal Zone (PRZ).
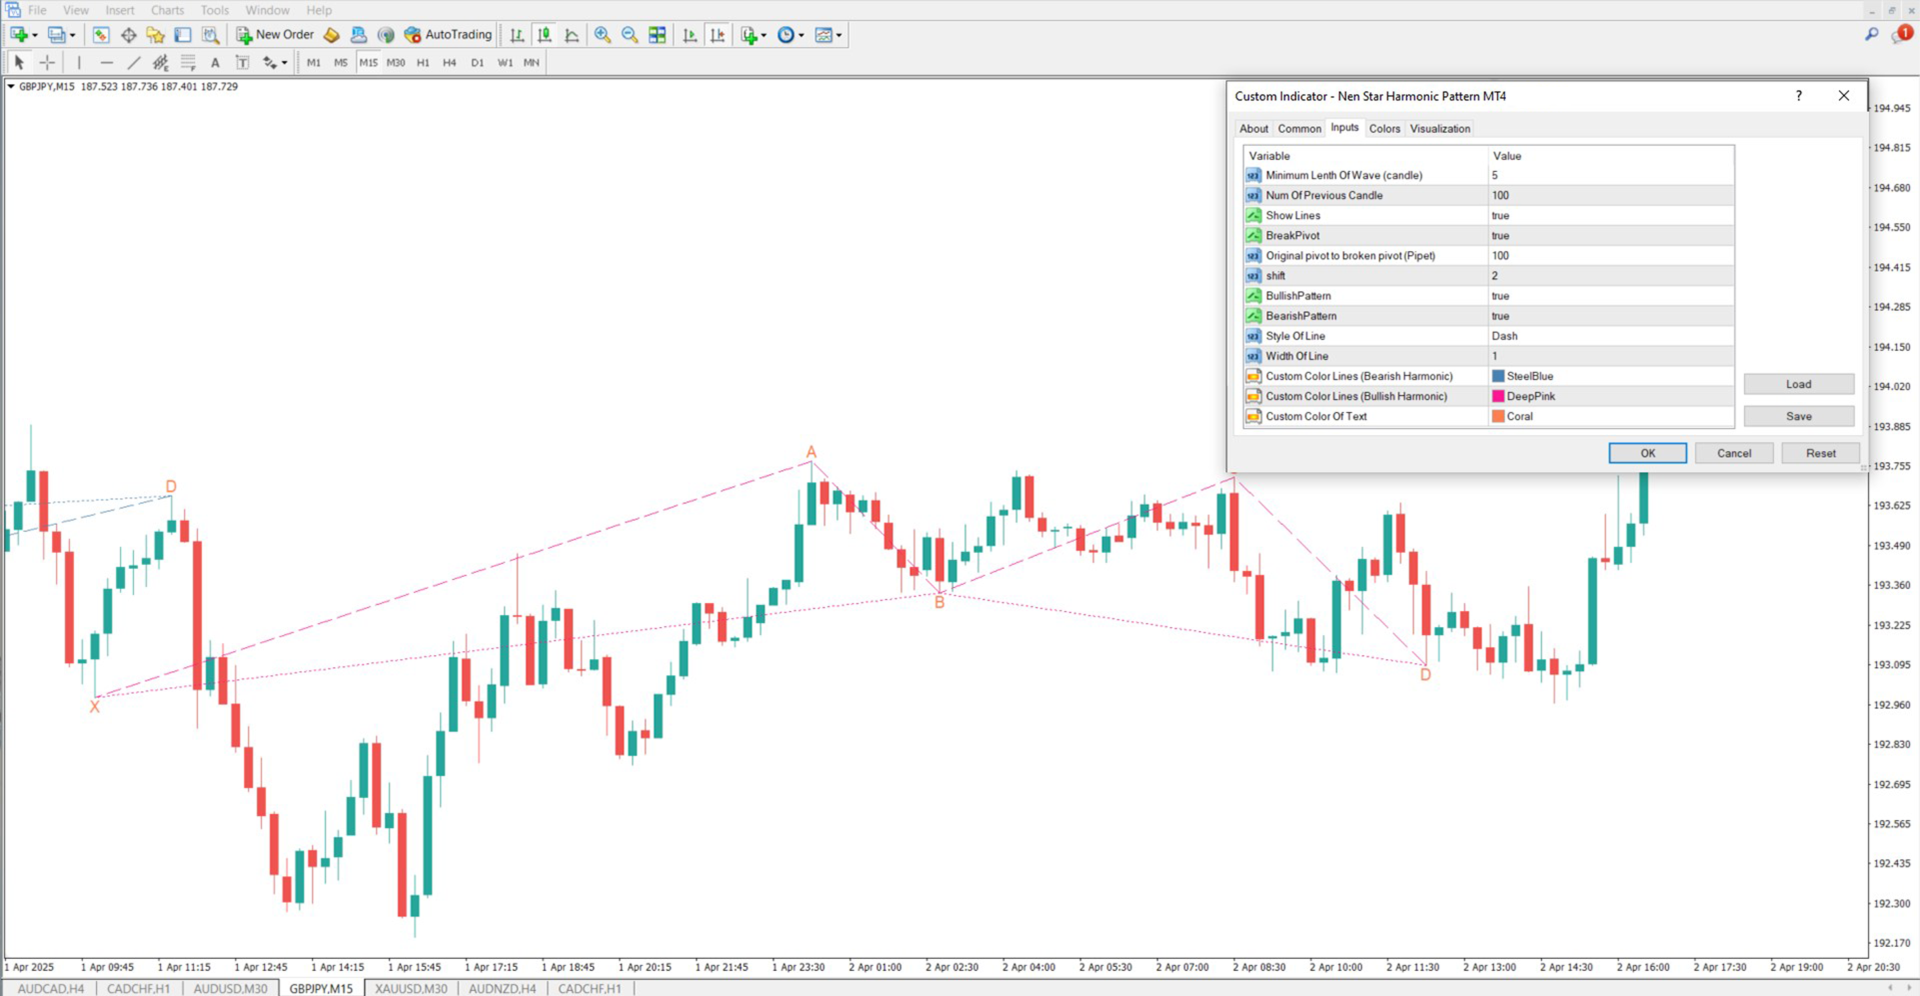
Indicator Settings
Key configurable parameters of the Nen Star Harmonic Pattern Indicator include:
- Minimum Length Of Wave (candle): Defines the minimum candles required to detect a wave
- Num Of Previous Candle: Number of previous candles used in calculations
- Show Lines: Toggle visibility of pattern lines
- BreakPivot: Enable/disable pivot break detection
- Original pivot to broken pivot (Pipet): Distance (in pipets) from original to broken pivot
- Shift: Offset for displaying the pattern on the chart
- BullishPattern: Enable detection of bullish patterns
- BearishPattern: Enable detection of bearish patterns
- Style Of Line: Select the line style for pattern display
- Width Of Line: Define the thickness of pattern lines
- Custom Color Lines (Bearish Harmonic): Set the color for bearish pattern lines
- Custom Color Lines (Bullish Harmonic): Set the color for bullish pattern lines
- Custom Color Of Text: Set the display color of text labels
Conclusion
The Nen Star Harmonic Pattern Indicator is a highly precise tool for identifying potential reversal zones in the market. When combined with multi-timeframe analysis, key support/resistance levels, and supplementary techniques like price action or candlestick patterns, its effectiveness increases significantly.