RSI Levels Indicator MT4
RSI Levels Indicator for MetaTrader 4
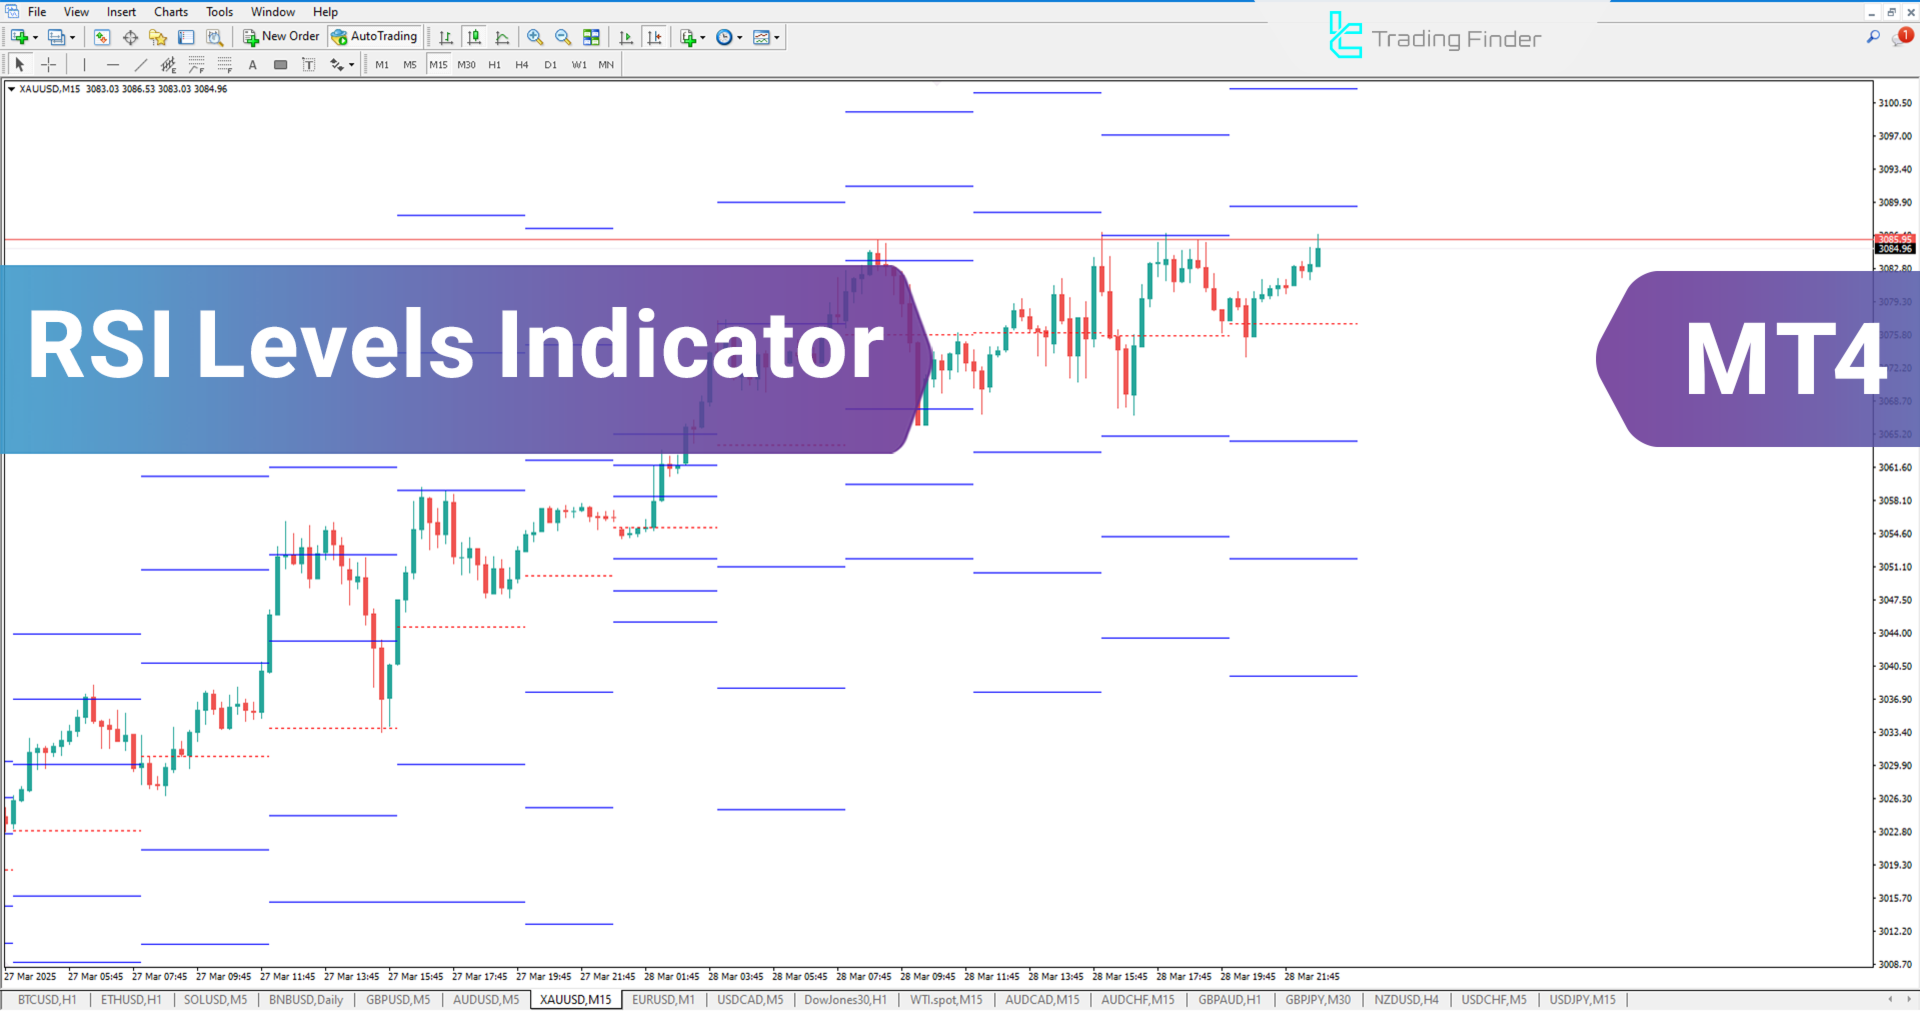
The RSI Levels Indicator for MetaTrader 4 is a technical tool designed to map out reactive price zones based on the Relative Strength Index (RSI) algorithm. It provides traders with a visual representation of RSI-derived levels directly on their charts, allowing for more precise technical evaluations.
This enhances the ability to anticipate potential price turns and fine-tune trade timing across different market conditions.
«Indicator Installation & User Guide»
MT4 Indicator Installation | RSI Levels Indicator MT5 | ALL Products By TradingFinderLab | Best MT4 Indicator: Refined Order Block Indicator for MT4 | Best MT4 Utility: Trade Assistant Expert TF MT4 | TP & SL Tool: Risk Reward Ratio Calculator RRR MT4 | Prop Firm Protector: Trade Assist Prop Firm Plus TF Expert MT4 | Money Management + DrawDown Protector: Trade Panel Prop Firm Drawdawn Limiter Pro MT4
RSI Levels Indicator Table
General features and details of the RSI Levels Indicator are listed below:
| Category | Levels & Zones – Volatility – Price Action |
| Platform | MetaTrader 4 |
| Skill Level | Beginner |
| Indicator Type | Reversal – Entry & Exit Zones |
| Timeframe | Multi-Timeframe Support |
| Trading Style | Scalping – Day Trading – Intraday Trading |
| Markets | Forex – Stocks – Indices |
Indicator at a Glance
The RSI Levels Indicator for MetaTrader 4 is ideal for pinpointing areas on the chart where price interaction is likely. These highlighted levels act as guides for optimal trade entries and exits, contributing to greater strategic precision. With this tool, traders can improve both the quality of their setups and the efficiency of their trade management.
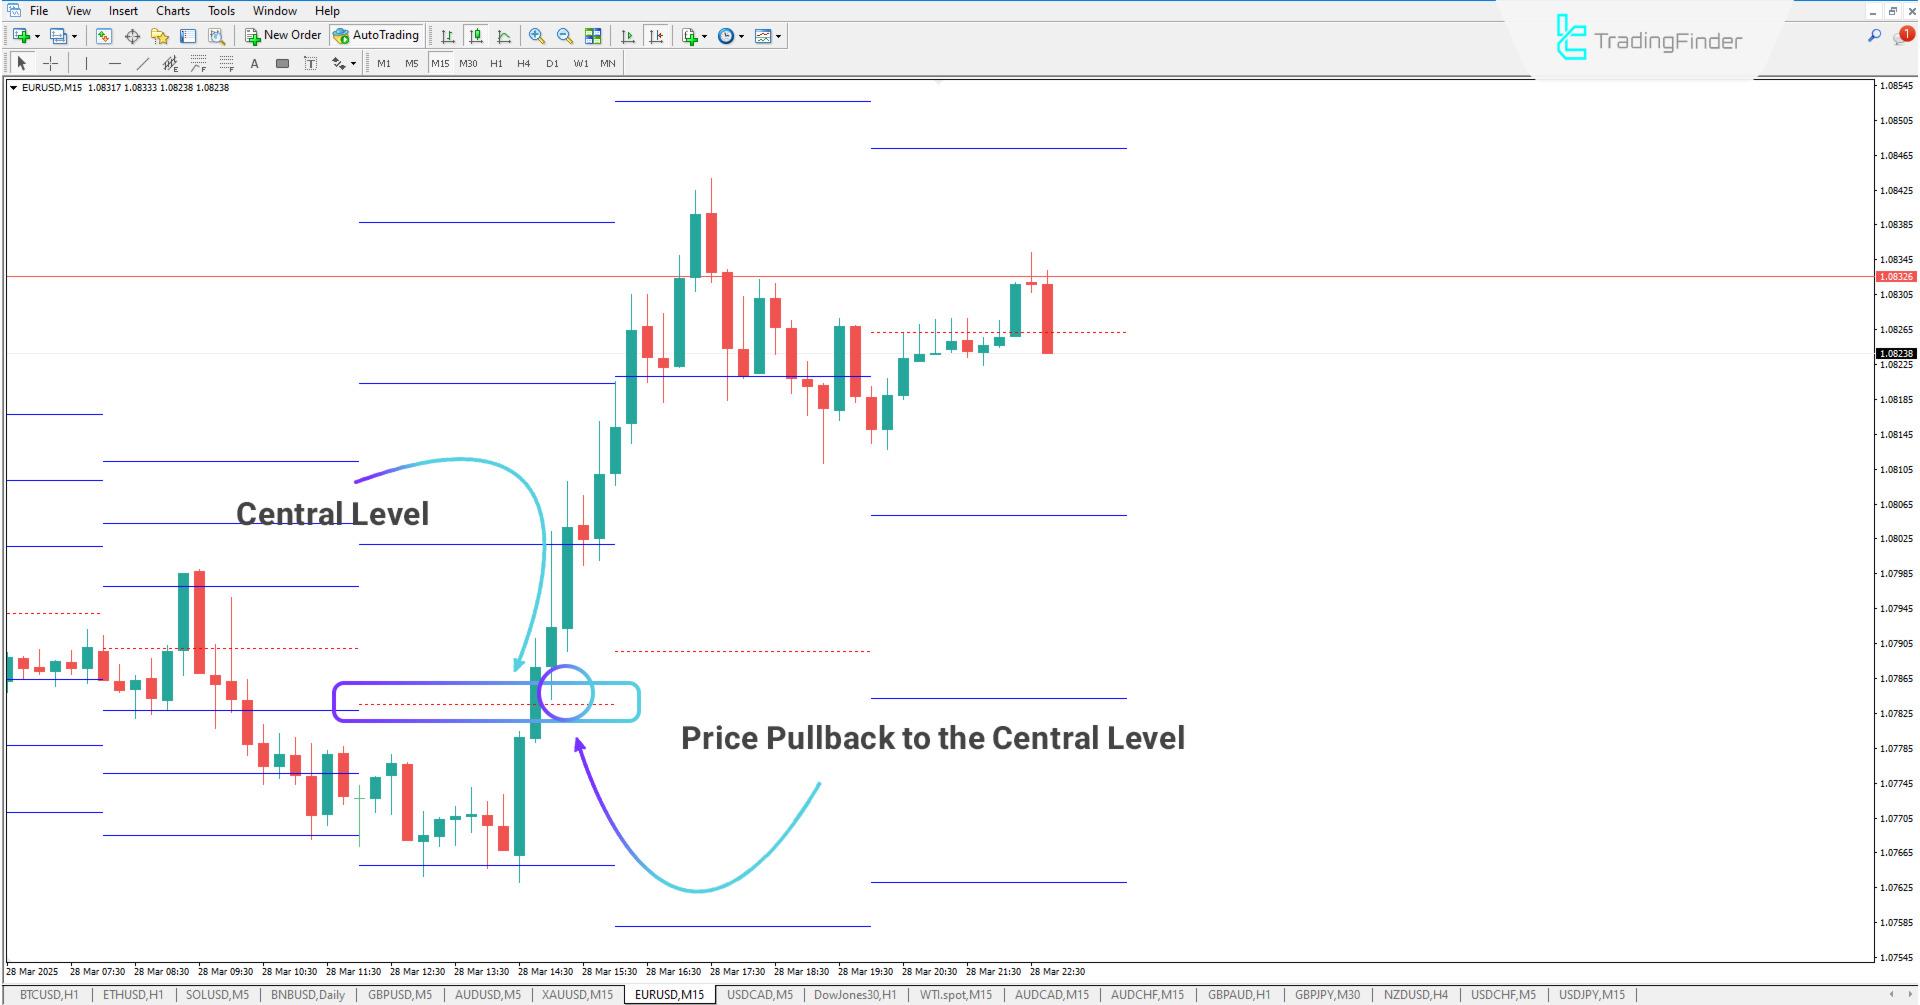
Uptrend Example
In the 15-minute EUR/USD chart, the indicator identifies reactive zones. Following a break above the central RSI level, the chart confirms a bullish structure. Price then revisits the central level (pullback), providing a high-probability buying opportunity.
These levels can serve as reference points for setting stop-loss and take-profit targets, refining risk management practices.
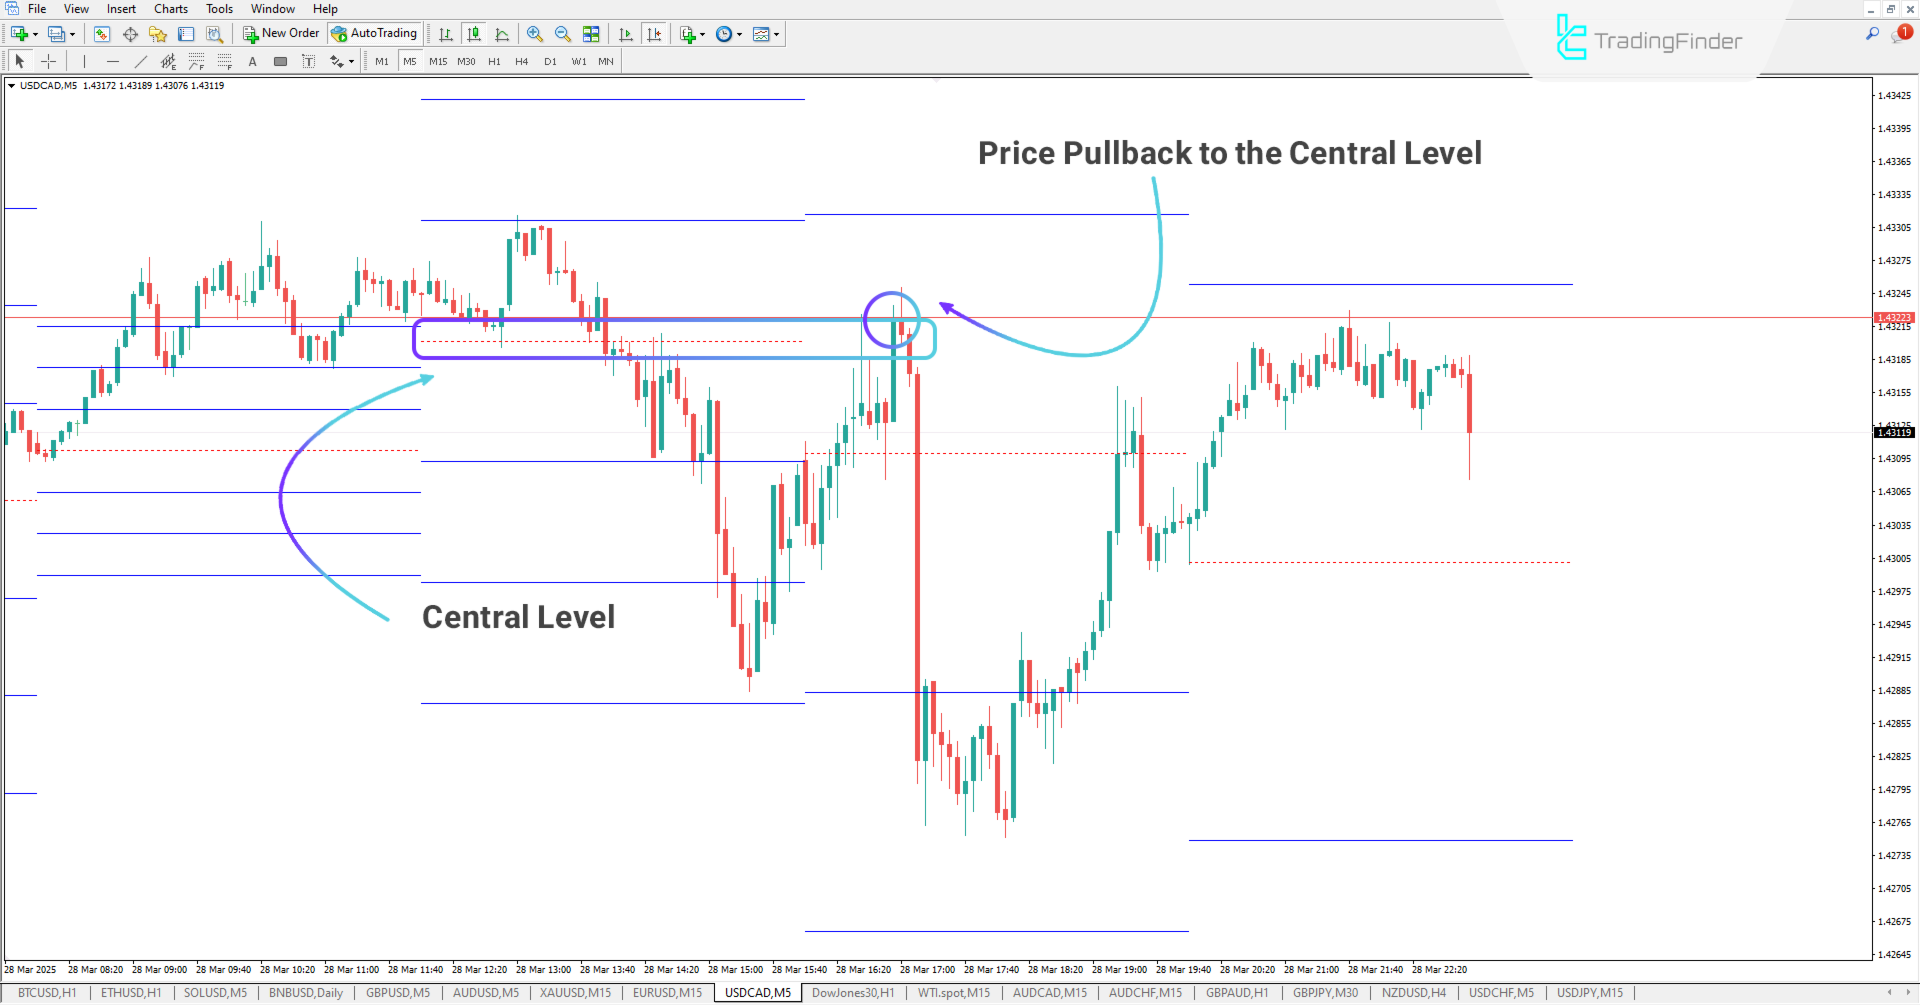
Downtrend Example
On the 5-minute USD/CAD chart, the indicator reveals a downward break below the central RSI level. After this breakout, price retests the same level before resuming its bearish direction. This setup often signals a continuation pattern, enabling traders to enter short positions with greater confidence.
The predefined levels function as both dynamic resistance and support, aiding in trade planning and confirmation.
RSI Levels Indicator Settings
Key customization options for the RSI Levels Indicator include:
- Level1: Sets the interval for the closest level;
- Level2: Defines the range for the second outer level;
- Level3: Adjusts the outermost level distance;
- Shift of last candle for Update Lines: Determines how far back the update applies;
- Number of Candles for Calculate RSI Levels: Specifies how many past candles are considered;
- Time Frame for Calculate RSI: Selects the timeframe used for RSI calculation;
- Time Frame for Update Lines: Sets how frequently the levels are updated;
- Main Line: Color settings for the central level;
- Lines: Color configuration for outer levels;
- Number of previous candles: Defines historical depth of calculations;
- RSI_Period: Controls RSI sensitivity by setting its period;
- Price: Chooses the price basis for RSI calculations (close, open, etc.).
Conclusion
The RSI Levels Indicator for MetaTrader 4 is a reliable tool for identifying reactive market levels based on RSI logic. Suitable for a wide range of instruments—including forex, equities, and indices—it helps traders gain better insight into price behavior.
By drawing a central level along with three upper and three lower RSI-based zones, this indicator offers an organized and data-driven approach to market structure analysis.